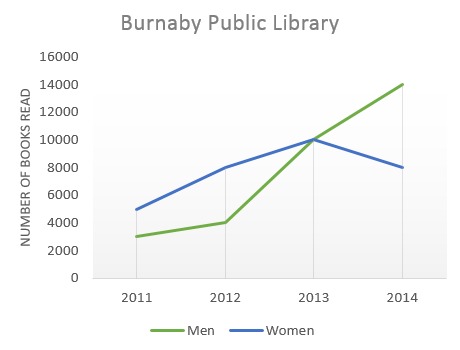
The graph shows the number of books read by men and women at Burnaby Public Library from 2011 to 2014.
Summarise the information by selecting and reporting the main features, and make comparisons where relevant.
The line graph indicates the quality of books that were read by males and females in the years between 2011 to 2014 at a public library in Burnaby.
The statistics suggest that 5000 books had been read by males in 2011. The trend gradually increases to 8000 books by the end of 2012. Additionally, the numbers of 2000 are added to 2013 alone until the ongoing trend passes its peak and dwindles downward to 8000 books again in 2014.
The books that were read by females, on the other hand, is starting insignificantly small, from the number of 3000 to 4000 in between 2011 and 2012. However, there is a big jump in 2013, the numbers of books rise above 10,000 at level. The uprising phenomenon does not stop at ten of thousands only, in 2014, the numbers of books reach 14,000 in total.
The data of the graph shows that men read more books than women by the additional numbers between 2000 to 4000 in the first two years. Nonetheless, the leading position has dramatically shifted when the time moves forward after mere two years. The numbers of women who read books outclass men by more than 6000 in the last year of 2014.
I am not sure if the writing structure is correct for the academic task one. I recently started doing IELTS task one academic practice as I thought it would help widen my vocabulary and to have an overall perspective on the IELTS system. I might as well take the academic one if necessary. So please, any constructive comment would be a great help to me! Thank you.
Summarise the information by selecting and reporting the main features, and make comparisons where relevant.
who reads more books, men or women?
The line graph indicates the quality of books that were read by males and females in the years between 2011 to 2014 at a public library in Burnaby.
The statistics suggest that 5000 books had been read by males in 2011. The trend gradually increases to 8000 books by the end of 2012. Additionally, the numbers of 2000 are added to 2013 alone until the ongoing trend passes its peak and dwindles downward to 8000 books again in 2014.
The books that were read by females, on the other hand, is starting insignificantly small, from the number of 3000 to 4000 in between 2011 and 2012. However, there is a big jump in 2013, the numbers of books rise above 10,000 at level. The uprising phenomenon does not stop at ten of thousands only, in 2014, the numbers of books reach 14,000 in total.
The data of the graph shows that men read more books than women by the additional numbers between 2000 to 4000 in the first two years. Nonetheless, the leading position has dramatically shifted when the time moves forward after mere two years. The numbers of women who read books outclass men by more than 6000 in the last year of 2014.
I am not sure if the writing structure is correct for the academic task one. I recently started doing IELTS task one academic practice as I thought it would help widen my vocabulary and to have an overall perspective on the IELTS system. I might as well take the academic one if necessary. So please, any constructive comment would be a great help to me! Thank you.

IELTS_Writing_Task_1.jpg
