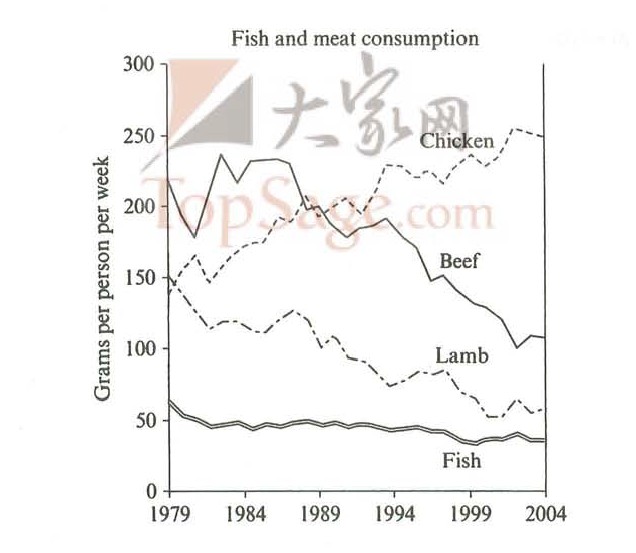
The line graph below shows the change in fish and other three types of meat consumption in a European country from 1979 to 2004.
It is clear that consumption in both beef and lamb enjoyed a gradual decrease trend throughout the period, while there was a considerable rise in chicken consumption, with the figure eventually overtaking beef and lamb consumption.
Between 1979 and 1989, lamb consumption dropped slowly from 150 to around 100 grams per person per week, while consumption of beef fluctuated, to nearly 200 grams per person per week. During the same period, the figure for chicken rose significantly from below 150 to just above 200 grams per person per week. However, fish consumption remained relatively stable, with around 50 grams per person per week.
By 2004, both beef and lamb consumption had plummeted massively, with figures reaching the bottom at around 100 and 50 grams per person per week respectively. By contrast, the amount of chicken consumed continued to rise quickly, reaching the top at about 250 grams per person per week in 2004. Interestingly, fish was still the least popular food, remaining at about 50 grams per person per week in 2004.

picture of line graph
