Unanswered [0] | Urgent [0]
  

Home / Writing Feedback   % width   Posts: 3


IELTS 1: The line graph compares 4 European nations in terms of the average carbon dioxide emissions


ngthuha 6 / 12  
Oct 17, 2020   #1

Average carbon dioxide emissions per person


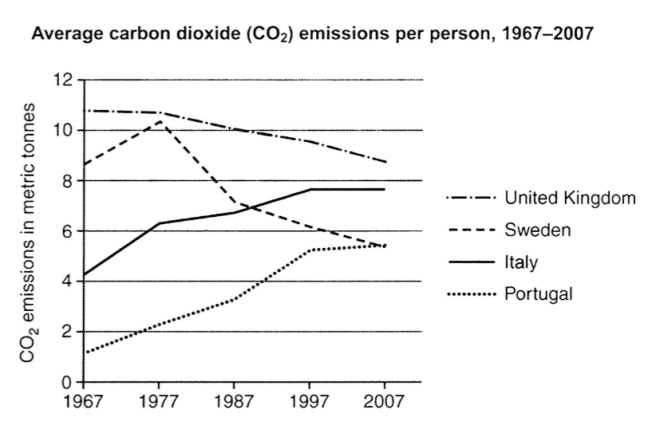
The line graph compares 4 European nations in terms of the average carbon dioxide emissions over the period from 1967 to 2007.
It is noticeable that the UK was responsible for the highest level of CO2 emissions. Moreover, a downward trend can be observed in emissions from Sweden throughout the period.

From 1967 to 1977, the amount of CO2 emissions in the UK remained unchanged, at around 11 metric tonnes per person. During the same period, an upward trend can be seen in 3 other countries: Sweden Italy and Portugal, with an increase to about 10.5 tonnes, 6.5 tonnes and 2.5 tonnes respectively.

By 2007, CO2 emissions from Sweden had plummeted to nearly 5.5 metric tonnes, whereas the respective amounts came from Italy and Portugal had considerably risen to 5.5 tonnes and 7.5 tonnes. By contrast, there had been a reduction in the level of CO2 in the UK since 1977, with a gradual decrease of around 2 metric tonnes per person at the end of the period.

  • writingtask1test.png


Holt  Educational Consultant - / 15344  
Oct 17, 2020   #2
Try to work on a more comprehensive summary. At least outline the names of the countries provided and the measurement used. These information can help the reader better understand and follow the report you are presenting. You should use the proper summary outline to help you gain a better TA score. While your presentation is acceptable, it could have been better.

The last 2 sentences of the first paragraph and the second paragraph presentation both follow the trending statement format. One of these have to change to a report format. You can only have one trending statement in the essay. It should not be located within 2 paragraphs.
OP ngthuha 6 / 12  
Oct 20, 2020   #3
@Holt I have rewritten my general trend paragraph. Could you check it for me whether it is good or not. Thank you so much!
It is noticeable that the UK was responsible for the highest level of CO2 emissions throughout the period. However, while the British and the Swedish people reduced their emissions, there was an upward trend in CO2 released from Italy and Portugal.


Home / Writing Feedback / IELTS 1: The line graph compares 4 European nations in terms of the average carbon dioxide emissions
Do You Need
Academic Writing
or Editing Help?
Need professional help with your assignments? Fill out one of these forms:

Graduate Writing / Editing:
GraduateWriter form ◳

Best Essay Service:
CustomPapers form ◳

Excellence in Editing:
Rose Editing ◳

AI-Paper Rewriting:
Robot Rewrite ◳