Hi there,
I wanter to reinforce my writing ability by practicing IELTS questions in my spare time. Hence, it would be helpful if you could give me some advises on grammar usage and how to improve the structure. :)
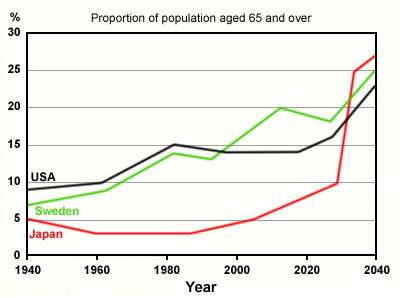
This line graph compares the population of aged 65 or more in three different countries between 1940 to 2040.
It is clear from the graph that the number of elderly people in each country has rose considerably between 1940 and 2020, and the figures are expected to reach their peak in 2040.
As can be seen from the graph that the highest proportion of elder people was in USA in 1940, at 9%, followed by Sweden with 7%, and the figure for Japan accounted for 5%. Between 1940 and 1980, the rising trends was shown in both Sweden and USA, from 7% to 14% and from 9% to 15%, respectively. In contrast, the population for aged 65 and older in Sweden experienced a small decrease and then remained unchanged at 3% by 1980. From 2000 to 2020, the elderly population in Japan slightly rose before descending to 19%, while the population reached its plateau in USA throughout the period shown.
Although the percentage for all countries is predicted to constantly ascend, the amount of elderly people in Japan is anticipated to exceed others and reach its summit by 2040.
I wanter to reinforce my writing ability by practicing IELTS questions in my spare time. Hence, it would be helpful if you could give me some advises on grammar usage and how to improve the structure. :)
Population of aged 65 and over
This line graph compares the population of aged 65 or more in three different countries between 1940 to 2040.
It is clear from the graph that the number of elderly people in each country has rose considerably between 1940 and 2020, and the figures are expected to reach their peak in 2040.
As can be seen from the graph that the highest proportion of elder people was in USA in 1940, at 9%, followed by Sweden with 7%, and the figure for Japan accounted for 5%. Between 1940 and 1980, the rising trends was shown in both Sweden and USA, from 7% to 14% and from 9% to 15%, respectively. In contrast, the population for aged 65 and older in Sweden experienced a small decrease and then remained unchanged at 3% by 1980. From 2000 to 2020, the elderly population in Japan slightly rose before descending to 19%, while the population reached its plateau in USA throughout the period shown.
Although the percentage for all countries is predicted to constantly ascend, the amount of elderly people in Japan is anticipated to exceed others and reach its summit by 2040.

xieltslinegraphpr.png
