Summarise the information by reporting the main features
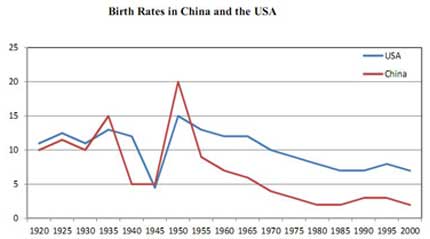
The line graph illustrates changes in America and China in terms of their birth rates from 1920 to 2000.
Overall, the fertility rates of both nations decreased over the 80-year period. Although the two trends were similar in terms of a general decline, the birth rate recorded in the USA was higher than that of China most of the given time.
Between 1920 and 1935, the birth rate in America fluctuated but remained over 10%. However, this figure dropped to its lowest point in the following decade, reaching 5% in 1945. Only 5 years later, the USA's birth rate reached 15% in the year 1950, which was the highest point during the period of 80 years. Throughout the remainder of the period, the USA witnessed a gradual decline in the rate of birth, finally falling to around 7% in 2000. In comparison with America, the China's corresponding figure varied more significantly in the same amount of time. Starting at 10% in the year 1920, China's birth rate changed unstably before bottoming out at 5% in 1940. From then, the rate remained unchanged for 5 years before peaking at exactly 20% in 1950. By contrast, the following 50 years experienced a rapid decline to nearly 3 % in the end of the period.
This is my response for the given question. Hope you guys can give me feedbacks! Thank you so much !!

Image
