Unanswered [1] | Urgent [0]
  

Home / Writing Feedback   % width   Posts: 2


The line graph describes the proportion of the population who used the internet in three countries


detpro69 1 / -  
Jul 8, 2021   #1

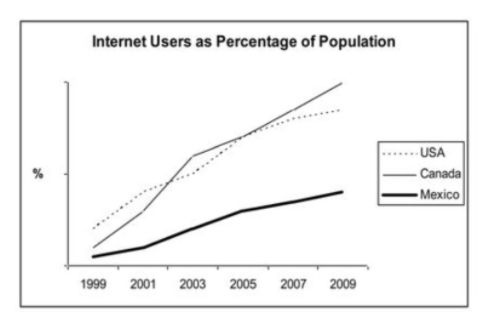
WRITING TASK 1: INTERNET USERS AS PERCENTAGE OF POPULATION


The line graph describes the proportion of the population who used the internet in three countries of America in the ten-year period, started at 1999.
Overall, the internet was spreading its popularity from time to time in both three countries. Additionally, Canada was the country with the highest internet users at the end of the period.

In the details, the figure for the USA's internet users was the highest, with 20% of the population using the internet in 1999, after that the figure for it increased dramatically to 80% in 2009. A similar pattern was witnessed in the USA, the percentage of USA's citizens using the internet increased significantly from 10% in 1999 to nearly 100% in 2009. The USA bypassed the other countries, became the nation using the internet the most.

A noticeable feature worth mentioning is that the speed of spread of the internet in Mexico was lower compared with that of the USA and that of Canada. The number of Internet users in Mexico rose from 5% in 1999 to 40% in 2009.

  • Untitled.png


Holt  Educational Consultant - / 15385  
Jul 9, 2021   #2
The writer needs to consult a world globe or map of the world. He misinformed the reader by saying that the line graph is composed of

three countries of America

. America is a seperate and sovereign country. Canada and Mexico are seperate countries as well. The TA section is affected by this misinformation. The ten-year period should be numerically indicated as well from the start to end year (e.g. 1999 to 2009).

It is strange that the writer referred to "other countries " in the second paragraph when he mistakenly referred to the same as " three countries" of America in the first paragraph. The writer ofviously failed to proofread his work prior to considering it completed. The information presentation meets the word requirement and provides an acceptable comparison presentation. It is the confusion about the B rations that presented a problem for the most part.


Home / Writing Feedback / The line graph describes the proportion of the population who used the internet in three countries
Need Writing or Editing Help?
Fill out one of these forms:

Graduate Writing / Editing:
GraduateWriter form ◳

Best Essay Service:
CustomPapers form ◳

Excellence in Editing:
Rose Editing ◳

AI-Paper Rewriting:
Robot Rewrite ◳

Academic AI Writer:
Custom AI Writer ◳