Unanswered [1]
  

Home / Writing Feedback   % width   Posts: 2


WRITING TASK1: LINE GRAPH - GREEN TRANSPORTATION USAGE


pnpu07 1 / -  
Sep 22, 2023   #1

GREEN TRANSPORTATION USAGE


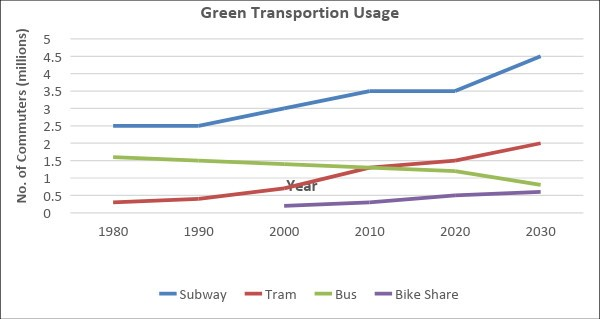
The line graph compares the amount of commuters in European metropolitan areas using four modes of transport over a period of 50 years.
Overall, although the subway was undoubtedly the most popular vehicle traffic during the period, others form of mobility more and more widespread, while bus usage declined.

In 1980, the number of subway ridership remained the highest, standing at 2,5 million, rose to 3,5 million in 2010 before being predicted to increase dramatically to 4,5 million in 2030. On the other hand, the percentage of bus rider, the second most common way to get to work 50 years ago at approximately 1,6 million, decreased gradually and scheduled to continue falling to just under 1 million user in 2030.

Among other forms of movement, the use of electric vehicles will increase most significantly. From less than a quarter of a million people in 1980, the amount of person riding electric surpassed bus ridership in 2010 and being slated to just over 2 million in 2030. Meanwhile, although bicycle sharing didn't become common until 2000, an upward trend each year since then is speculated on start challenging bus ridership by 2030.

  • TASK1.png


Holt  Educational Consultant - / 15460  
Oct 7, 2023   #2
The summary overview is not well developed. You need to learn to enumerate the required information such as the types of transport and measurement type. The trending statement was confusing to read because you did not properly reference the other transport forms. Modes of mobility is confusing for most readers, who are looking for direct reference points to the original discussion.

rider

You should use the +S version here. That way you properly address the information as being in plural form. Rememeber that in the task 1 essay, the plural form is more often used than the singular form of a word.

Overall, you made a good effort at analyzing the information. You just need to form the presentation properly for a better score.


Home / Writing Feedback / WRITING TASK1: LINE GRAPH - GREEN TRANSPORTATION USAGE
ⓘ Need Writing or Editing Help?
Fill out one of these forms for professional help:

Best Writing Service:
CustomPapers form ◳

Graduate Writing / Editing:
GraduateWriter form ◳

Excellence in Editing:
Rose Editing ◳

AI-Paper Rewriting:
Robot Rewrite ◳