Unanswered [1]
  

Home / Writing Feedback   % width   Posts: 5


The line graph illustrates car thefts in Great Britain, France, Sweden and Canada from 1990 to 1999


THC1310vn 7 / 19  
Mar 1, 2020   #1

ielts Line graph about car theft in four countries


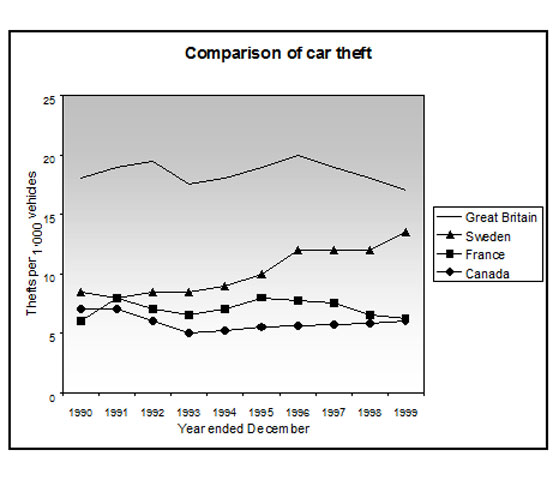
The line graph illustrates car thefts in Great Britain, France, Sweden and Canada from 1990 to 1999. Unit was measured in thousand.
Overall, the rate of car theft in Britain topped the list throughout the 9-year period. Meanwhile, there was a downward trend in the rates in both France and Canada.

In detail, the figures for vehicles thefts in Britain tallied about 17 thousands cases in 1990 before increase to 20 thousands cases 6 years later. Although it saw a drop in the end of the period, Britain was still reported the most cases among four countries. This was closely followed by Sweden where an average of 8 thousands cars were stolen in the initial year. Then, the rates significantly surged to 12 thousands thefts before peaking at 14 thousands thefts.

In stark contrast, the cases of car theft shrank from 7 thousands to 5 thousands after 3 years, but it slightly rebounded to 6 thousands after a 9-year period. In addition, the figures for car theft in France peaked at 8 thousands, exceeding Canada's rates and being reported the same figures in comparison with Sweden in 1991.

  • xieltslinegraphca.jpg


Holt  Educational Consultant - / 15460  
Mar 2, 2020   #2
There was a bit of information that you forgot to include in your summary overview. You could have written 4 sentences and shows a thorough summary of the indicated information had you remembered to explain that the theft measurements ended in December of 1999. A statement saying the following would have sufficed:

The measurements were measured regularly until the close of the year in December 1999.

This measurement end indication would have thoroughly completed the presentation and shown that you fully understood the importance of all the given data in the line graph.

There is no plural form for thousand. You cannot say "thousands" as that is an error in the noun phrase presentation. Repeatedly making this mistake in your essay will result in GRA points deductions.

Remember that you are describing the information "in progress" therefore, a reference to the future increase must be made. the future form of increase must be used which is "increasing". Again, GRA scoring for your essay will be affected.

Most of your errors in this essay are grammar based. One of the other errors that I noticed was the lack of use of the Oxford comma when listing the names of the countries in the summary overview. You cannot simply go to the word "and..." without first indicating a comma as a separator for the information.

Since most of the numerical references in the chart are based on approximations, you should have used more terms of uncertainty in the essay when referring to the numerical data. This is in contrast to the measurements where actual figures are indicated. Since there is no solid figure given, estimations reflect the uncertainty of the given information. Be certain in your data presentation when it is clearly indicated in the chart, offer a close guess when no figure is indicated. You need to learn to be able to tell the difference. You need to understand when you use actual figures in a certain presentation, and when to use estimates using "uncertainty" in your presentation. This will show that you understand the intricacies of a detailed report and that you are focused on the accuracy of the report rather than the word count.
OP THC1310vn 7 / 19  
Mar 2, 2020   #3
Thank you very much @ Holt. I will try my best to indicate all the given information and fix my usage of units net time.
vuthuylinh2611 19 / 61  
Mar 3, 2020   #4
Your first sentence in your third paragraph does not state clearly which country are you referring to. It cause difficulty to reader to understand your essay.
HoangThuyAn 2 / 3  
Mar 9, 2020   #5
a number ( 1,2,3,...) + thousand/ million/billion... +Ns
Eg: 17 thousands cases


Home / Writing Feedback / The line graph illustrates car thefts in Great Britain, France, Sweden and Canada from 1990 to 1999
ⓘ Need Writing or Editing Help?
Fill out one of these forms for professional help:

Best Writing Service:
CustomPapers form ◳

Graduate Writing / Editing:
GraduateWriter form ◳

Excellence in Editing:
Rose Editing ◳

AI-Paper Rewriting:
Robot Rewrite ◳