Unanswered [6] | Urgent [0]
  

Home / Writing Feedback   % width   Posts: 2


The line graph illustrates figures for global meetings in three different capital cities 1980-2010


HanhNguyen 1 / -  
Aug 20, 2018   #1

International conferences


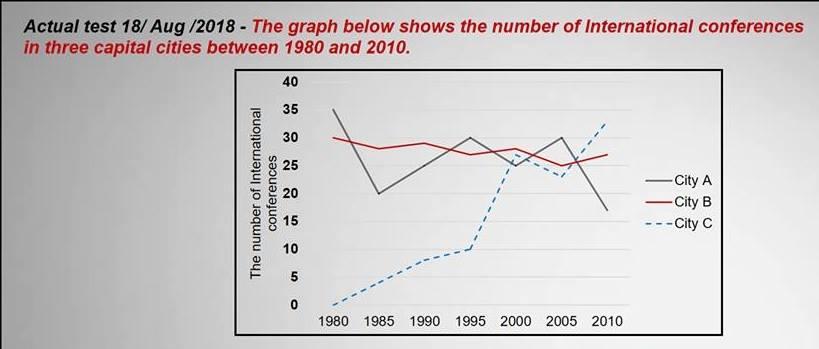
The line graph illustrates figures for global meetings in three different capital cities from 1980 to 2010.

Overall, the most dramactic increase can be seen in the number of international conferences in city C. Meanwhile, while city A saw a significant fluctuation in the figure for meetings which were held globally, this number for city B experienced a period of stability with a slight change.

In the year 1980, 35 meetings were held in city A, which was the highest number among three capital cities. The figure for international meetings in city B was lower, with the total of 30 conferences, whereas City C did not held any meeting in this year. By contrast, in the next 20 years, there was a considerable growth in the number of conferences which were held in city C, to around 27 meetings, surpassing this figure for city A. The number of global meeting in city B remained stable, at around 28 conferences at the same time.

From 2005 to 2010, an opposite trend can be seen in the amount of global conferences in two cities A and C. This number for city C reached its peak of the period, at around 33 meetings, whereas city A fell sharply to hit the lowest point, at 17 conferences 2010. 27 is the total number of international meetings which were organized in city B in the same year.

  • 39454461_10745345093.jpg


Holt  Educational Consultant - / 15388  
Aug 21, 2018   #2
Nguyen, I do not think that you wrote this essay under time pressure practice settings. That is because you wrote 232 words, which is an unrealistic number of words to write within 20 minutes. You can only write between 150-200 words in the actual test setting. You need to learn to compress your statements within your paragraphs. Use less descriptive words and more factual references.

Work on your opening summary. Make sure you always include the overview of the information you will be presenting to the reader so that there will be a clear indication of discussion points and presentation areas. That includes a presentation of the cities for comparison as these complete the summary overview information list. It also tells the reader when to expect that particular discussion in the essay.

Since this is a comparative analysis essay, you should have indicated that the 3 cities hosted the same number of conferences in 2009. There is a part of the graph where there were 3 intersecting points representing the 3 cities. That means that these cities all hosted 25 conferences each during this period. This is the type of deep analysis of an image that can help to boost your scores as opposed to repetitively presenting information.

You did a good job in dividing the presentation into year brackets. However, you should have clearly indicated the bracket in the third paragraph so that the reader would have been clear about what information is being presented. Be uniform in your presentation. Since you mentioned that the years for discussion in 2005 extended to 2010, then you should have done the same for the previous paragraph also.


Home / Writing Feedback / The line graph illustrates figures for global meetings in three different capital cities 1980-2010
Need Writing or Editing Help?
Fill out one of these forms:

Graduate Writing / Editing:
GraduateWriter form ◳

Best Essay Service:
CustomPapers form ◳

Excellence in Editing:
Rose Editing ◳

AI-Paper Rewriting:
Robot Rewrite ◳

Academic AI Writer:
Custom AI Writer ◳