Hello everyone, this is my first attempt to do the IELTS Writing Task 1 and I would be really appreciated if you guys can give me feedbacks and the possible band score.
Thank you so much!
Task
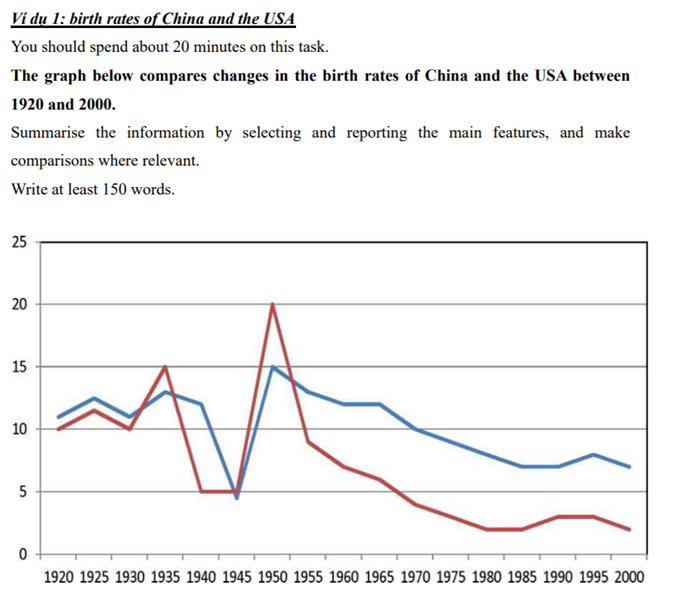
The line graph indicates how the birth rates of China and the USA fluctuated from 1920 to 2000.
Overall, the birth rates of both nations decreased over the period of 80 years. Although the two trends were similar in terms of a general decline, the fertility of the USA was higher than that of China in most years.
From 1920 to 1935, the birth rate in America fluctuated considerably, although it always remained above 10%. However, in the following decade, the American birth rate reached its bottom of under 5%. In the 1945-1950 period, the figure for the USA increased significantly to 15%, which was its highest rate over the period of 80 years. During the remainder of the period, there was a gradual decline in the USA birth rate, which fell to 7% by the year 2000.
Over the same period, the birth rate in China varied more significantly than in the USA. It dropped to and remained 5% from 1940 to 1945, before reaching its peak of 20% in 1950. By contrast, in the next five years, the figure declined rapidly to 8%. Similar to the USA, China experienced a gradual decrease in birth rate from 1955 to 2000, which dropped to 2% in 2000. (207 words)
Thank you so much!
Task
IELTS WRITING TASK 1: Birth rates of China and USA
The line graph indicates how the birth rates of China and the USA fluctuated from 1920 to 2000.
Overall, the birth rates of both nations decreased over the period of 80 years. Although the two trends were similar in terms of a general decline, the fertility of the USA was higher than that of China in most years.
From 1920 to 1935, the birth rate in America fluctuated considerably, although it always remained above 10%. However, in the following decade, the American birth rate reached its bottom of under 5%. In the 1945-1950 period, the figure for the USA increased significantly to 15%, which was its highest rate over the period of 80 years. During the remainder of the period, there was a gradual decline in the USA birth rate, which fell to 7% by the year 2000.
Over the same period, the birth rate in China varied more significantly than in the USA. It dropped to and remained 5% from 1940 to 1945, before reaching its peak of 20% in 1950. By contrast, in the next five years, the figure declined rapidly to 8%. Similar to the USA, China experienced a gradual decrease in birth rate from 1955 to 2000, which dropped to 2% in 2000. (207 words)

107490996_9440715660.png
