Unanswered [1] | Urgent [0]
  

Home / Writing Feedback   % width   Posts: 5


IELTS Line Graph - the percentage of the population aged 65 or more in Japan, Sweden, and USA


Holan 3 / 6  
Sep 3, 2020   #1

the proportion of the elderly population in three countries


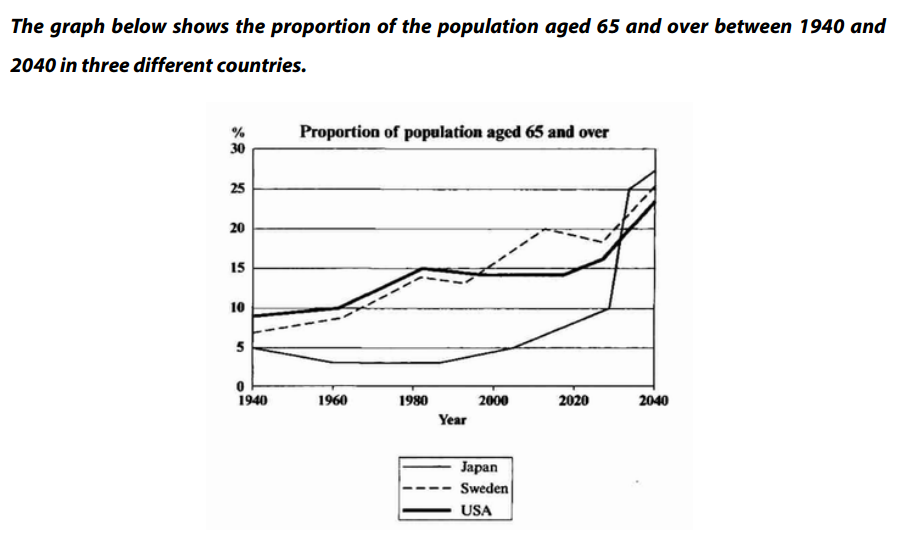
The given line graph compares the percentage of the population aged 65 or more in Japan, Sweden, and USA over a period of 100 years.

It is clear that the proportion of elderly people in each country increases between 1940 and 2040. In addition, Japan is expected to witness substantial changes in its elderly population.

In 1940, around 9% of the American population aged 65 or over, in comparison with about 7% and 5% of that figure for Sweden and Japan respectively. Over the next 50 years, the proportion of the elderly population in the USA and Sweden rose gradually, reaching approximately 15% in 1990. In contrast, that figure for Japan fluctuated around 4% and remained under 5% until the early 2000s.

Looking forward to the future, the percentage of Japanese aged 65 or more is predicted to experience a dramatic increase of over 20% in just 40 years from 2000 to 2040. In 2040, the figures for Sweden and USA will be slightly lower than the figure for Japan, at about 25% and 23% respectively.

  • PopulationAged65a.png


echeveria09 2 / 4  
Sep 4, 2020   #2
I think it would be "the elderly" instead of "elderly people" and you lack the conclusion. Hope you will do better in the next time!
Holt  Educational Consultant - / 15344  
Sep 4, 2020   #3
In the summary overview, do not make vague references to the timeline presented in the graph. This indicates the year1940 up to 2040. The accuracy of the report will be needed in the summary overview so use the actual years from the original reference. You can still use the century reference later on, within the trending statement. Do not use the current / present tense with regards to your references. Since this is a future event the word "will" should be prominent in the presentation. "Will" and any variation of the word refers to the upcoming event or measurement as indicated in the graph. Use a uniform paragraph presentation. Always present anywhere between 3-5 sentences. Never present a 2 sentence paragraph because that, for sure, contains a run-on sentence, which will lower your GRA score.
khanhu010101 3 / 4  
Sep 6, 2020   #4
- In the introduction, I think you should mention the year 1940 instead of just mentioning "100 years", you can write : "over a period of 100 years from the year 1940", it may be much clearer.

- In 2040, the figures for Sweden and USA will be slightly lower than the figure for Japan, at about 25% and 23% respectively. You should not use the word "will". Instead, use some other following : "is predicted", "is expected".

Hope this will help you!
EveIssabelle 1 / 2  
Sep 6, 2020   #5
I think you should put some word in parapraph 2: in general, overall....


Home / Writing Feedback / IELTS Line Graph - the percentage of the population aged 65 or more in Japan, Sweden, and USA
Do You Need
Academic Writing
or Editing Help?
Need professional help with your assignments? Fill out one of these forms:

Graduate Writing / Editing:
GraduateWriter form ◳

Best Essay Service:
CustomPapers form ◳

Excellence in Editing:
Rose Editing ◳

AI-Paper Rewriting:
Robot Rewrite ◳