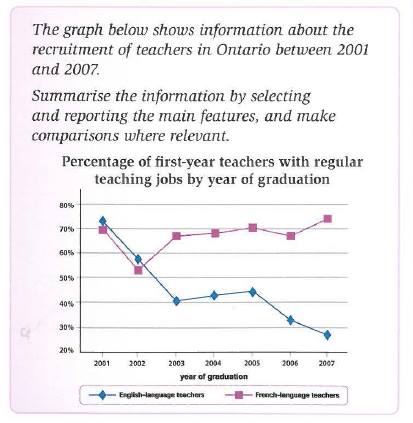
The given line graph reveals information about educator recruitment, located in Ontario over seven-year period, started from 2001 to 2007. Overall, it can be obviously be seen that the percentage of French teachers experience upward trend while that of English teachers witnesses downward tendency.
Looking at the detail, in the first period English-language educators overtook the higher number rather than French tutor, standing at more than seven in ten before it declined dramatically as long as two years to 40%. This trend was different from the point of French teachers which decreased steeply only in 2002 and hit a low of approximately a half, yet the next period saw a sudden rise to almost 70%. Despite of some fluctuation, the needs of French teacher finally reached a peak at virtually 72% in the end period (2007). Equally important, the demand of English tutor continually fell between 2005 and 2007 to the point of less than a third.
Looking at the detail, in the first period English-language educators overtook the higher number rather than French tutor, standing at more than seven in ten before it declined dramatically as long as two years to 40%. This trend was different from the point of French teachers which decreased steeply only in 2002 and hit a low of approximately a half, yet the next period saw a sudden rise to almost 70%. Despite of some fluctuation, the needs of French teacher finally reached a peak at virtually 72% in the end period (2007). Equally important, the demand of English tutor continually fell between 2005 and 2007 to the point of less than a third.

12767388_12231997477.jpg
