THE FIRST ESSAY
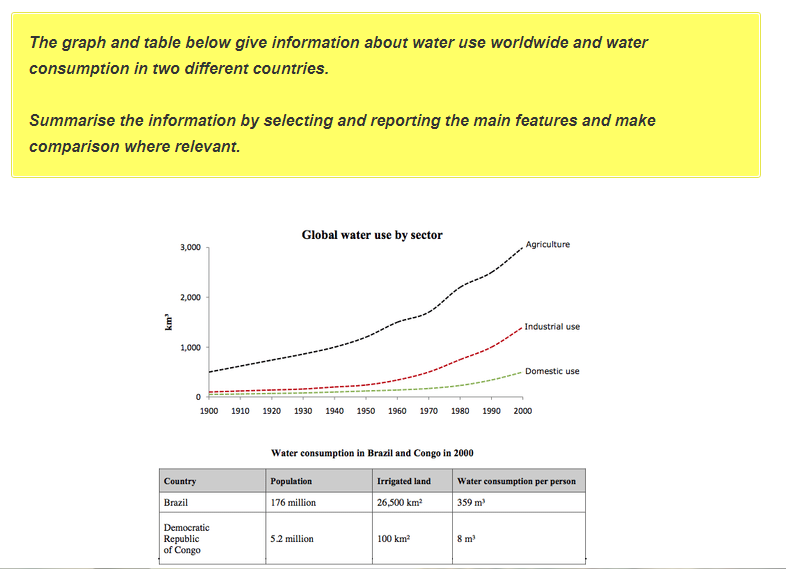
The graph illustrates water consumed on the world and the table compares water use between two countries namely Brazil, Democractic Republic of Congo.
Overall, almost gobal water ulitized for agriculture, including Brazil and Democractic Republic of Congo, this increased in each sector. Moreover, the high population as Brazil absorbed more water than th nation which is less citizen as Congo.
It is clear that 500 km3 water was used for irrigated sector in 1900. After on hundred years, this increased six times as much as one in 1900. Industry and domesticity were consumed less than 100 km3 water in 1900: however, there were rose 1000km3 and 250 km3 water repectively in 2000.
According to the data, Brazil's popoulation is 176 million and 26500km2 land was spent for cultivating and breeding. One person living in Brazil wasted 359 m3 water while 8 m3 water was a number of a citizen in Congo where was the inhabitant of 5.2 million people and 100 km2 land in here was irrigated land used in 2000.
water use worldwide and the water consumption
The graph illustrates water consumed on the world and the table compares water use between two countries namely Brazil, Democractic Republic of Congo.
Overall, almost gobal water ulitized for agriculture, including Brazil and Democractic Republic of Congo, this increased in each sector. Moreover, the high population as Brazil absorbed more water than th nation which is less citizen as Congo.
It is clear that 500 km3 water was used for irrigated sector in 1900. After on hundred years, this increased six times as much as one in 1900. Industry and domesticity were consumed less than 100 km3 water in 1900: however, there were rose 1000km3 and 250 km3 water repectively in 2000.
According to the data, Brazil's popoulation is 176 million and 26500km2 land was spent for cultivating and breeding. One person living in Brazil wasted 359 m3 water while 8 m3 water was a number of a citizen in Congo where was the inhabitant of 5.2 million people and 100 km2 land in here was irrigated land used in 2000.

The graph and table below give information about water use worldwide and the water consumption
