Please give me some comments on my essay. Thank you very much!
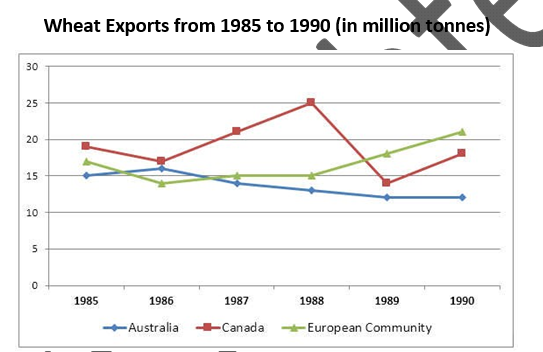
The graph below shows the differences in wheat exports over the three different areas.
The above given graph provides information about the changes in exporting wheat from 3 countries through 15 years. As can be seen, the number of wheat exports in Canada had a downward trend when in Australia the tonnes of wheat exports fluctuated and European Community showed an increase.
From 1985 to 1986, there is marginally drop exporting wheat in Canada, by 20 million tonnes to 17 million tonnes. However, the next 20 years witnessed an enormously increase to 25 million tonnes. Canada reached the highest point in 1988, it is also the largest wheat exports in three areas from 1985 to 1990. On the contrary, the number of wheat exports waved dramatically between 25 million tonnes and 15 million tonnes. As the same time, the amount of European Community's exports witnessed a gradually reduction, started at 19 million tonnes to 14.5 million tonnes, and then climbed to 21 million tonnes in 1990. The year 1990 recorded change in the number of wheat exports compared to 1988, when European Community is the top choice to import wheat in other countries. 15 million tonnes were exported from Australia in 1985, and it showed an upward trend in 1986 to 19 million tonnes but then decreased nearly 10 million tonnes from 1987 to 1990.
The graph below shows the differences in wheat exports over the three different areas.
Write a report for a university lecturer describing the information shown below.
The above given graph provides information about the changes in exporting wheat from 3 countries through 15 years. As can be seen, the number of wheat exports in Canada had a downward trend when in Australia the tonnes of wheat exports fluctuated and European Community showed an increase.
From 1985 to 1986, there is marginally drop exporting wheat in Canada, by 20 million tonnes to 17 million tonnes. However, the next 20 years witnessed an enormously increase to 25 million tonnes. Canada reached the highest point in 1988, it is also the largest wheat exports in three areas from 1985 to 1990. On the contrary, the number of wheat exports waved dramatically between 25 million tonnes and 15 million tonnes. As the same time, the amount of European Community's exports witnessed a gradually reduction, started at 19 million tonnes to 14.5 million tonnes, and then climbed to 21 million tonnes in 1990. The year 1990 recorded change in the number of wheat exports compared to 1988, when European Community is the top choice to import wheat in other countries. 15 million tonnes were exported from Australia in 1985, and it showed an upward trend in 1986 to 19 million tonnes but then decreased nearly 10 million tonnes from 1987 to 1990.

Screenshot2.png
