Unanswered [1] | Urgent [0]
  

Home / Writing Feedback   % width   Posts: 2


Writing 1: The line shows the percentage of tourists to Scotland who visited Edinburgh attractions


VanVan Nguyen 1 / -  
Feb 19, 2021   #1

visitors in the Edinburgh city


The line graph provide infromation about the percentage of tourists to Scotland who visited Edingurgh attrations.In generall, there were many differences about the years and the travel destinations. Contrary to Castle increased sharphy, there was a slight growth in Festival.

In 1980, the percentage of tourists who visited Castle was nearly 25% and significantly higher than zoo at 15%. About 15 years later, the percentage of Castle went up rapidly and reaches a peak at nearly 45%. In 2010, the rate of tourists dropped to just over 30%. During the first 20 years, there was a moderate fluctuation in the percentage of tourists to the zoo. However, in ten years later, the figure for the zoo then increased rapidly to 20%.

We can see that Festival was the most attractive place in Scotland in 1980 with 30% of tourists choosing. Despite having a good begining, Festival stayed unchanged during the last years and ending at roughtly 25% at the end of the period. Aquarium increased sharply from 1980 to 1985 to reach the highest point at over 35% in 1985. Since then, the percentage of Aquarium slumped dramatically to just under 10% in 2010
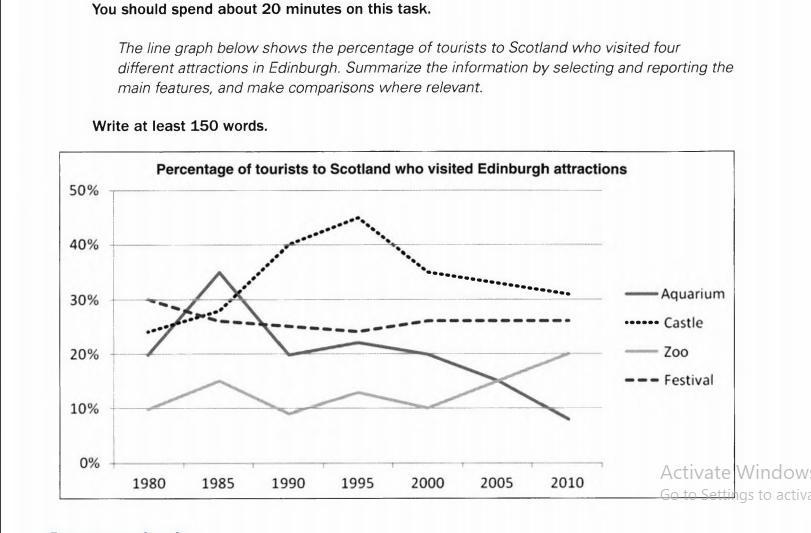

  • This is the line graph


Holt  Educational Consultant - / 15384  
Feb 20, 2021   #2
You have several spelling errors in the presentation that show a lack of proof reading for this paper. You failed to properly examine your draft for possible errors that, if corrected would have improved your GRA and LR scores individually for a higher overall score. Information accuracy is important in the Task 1 presentation. That does not refer only to the numbers presented, but the other information provided as well, including the location source for the information.

The comparison presentation is acceptable as it presents the immediate information that the eyes could see. However, there were overlapping years for the information that were not part of your presentation. An overlap is where the lines intersect, indicating an equal count for that period for the information provided. Such analysis presentation would have shown a true comparison presentation that would have helped your individual TA score and could have boosted the final overall score.


Home / Writing Feedback / Writing 1: The line shows the percentage of tourists to Scotland who visited Edinburgh attractions
Do You Need
Academic Writing
or Editing Help?
Fill out one of these forms:

Graduate Writing / Editing:
GraduateWriter form ◳

Best Essay Service:
CustomPapers form ◳

Excellence in Editing:
Rose Editing ◳

AI-Paper Rewriting:
Robot Rewrite ◳

Academic AI Writer:
Custom AI Writer ◳