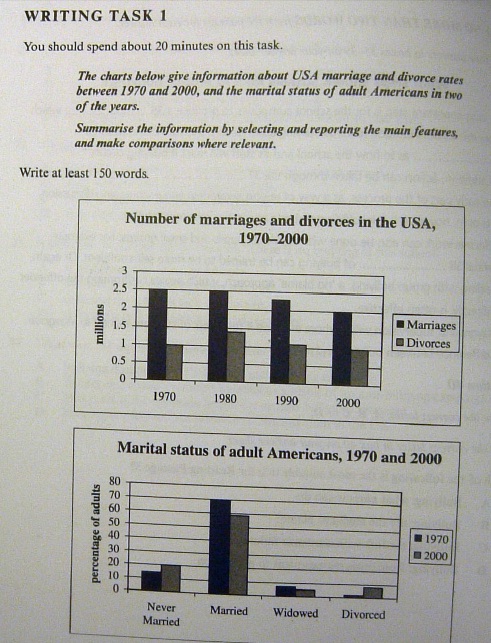
The first bar graph provides information regarding the rates of marriage and divorce in USA from 1970 to 2000, while the second chart compares between the percentage of adult American based on their marital status in 1970 and that of in 2000.
Generally, the number of marriage tended to decrease over the three decades while divorce rate experienced fluctuation. Furthermore, married adults dominated the other three status of adult Americans and each gap of the composition was very narrow.
For a more detailed look at the graph reveals that the number of marriages in USA was 2.5 million in 1970, then remained stable until 1980. However, it started to decline to approximately 2.25 million in 1990, and continued to decrease until just 2 million in the following ten years. On the other hand, the rate of divorce was 1 million in the beginning pointed year. Ten years after that, this number increased to just below 1.5, more than a half of marriages number. Started from 1990, it decreased onward and halved exactly the marriages number in 2000, reached the same number in the former year (1970).
Both the percentage of married and widow adults were higher in the first pointed year. The difference between married adult in 1970 and that of in 2000 was 11% and between widowed adult in the same pointed year was just around 1 percent. In contrast, unmarried old people and divorced old inhabitants were increased in 2000. Both of them experienced 5% increase (never married category proportion grew from 15% to 20% and divorced group inclined from 2% to 7%).

