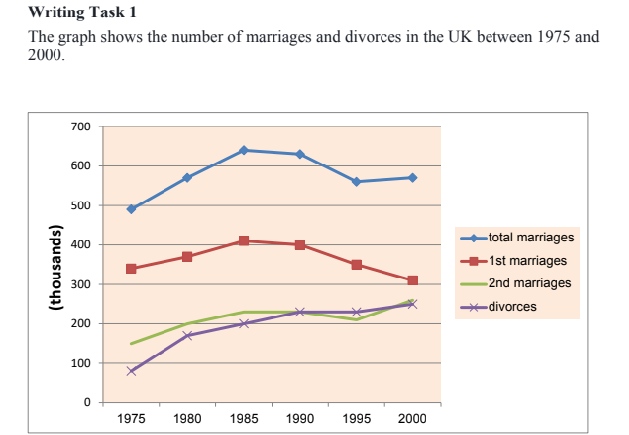
TASK 1 line graph shows the number of marriages and divorces in the UK
The line graph illustrates how many marriages and divorces in the UK in the period of 25 years.
Overall, the total number of marriages increased over the period in which the number of first marriages declined. The figure of divorces was a downward trend.
There were almost 500 thousands of total marriages which increased considerably to reach a peak of 640 thousand in 1985 before decreasing to 580 thousands of marriages at the end of the period. By contrast, the number of first marriages increasing from 330 thousand to 410 thousand witnessed a slight decrease to just over 300 thousand in 2000.
Whereas standing at 150 thousand in 1975, the number of second marriages rose minimally to 260 thousand at the end of the period. In 1975, there were only 80 thousands of divorces, but this number was nearly doubled in 1985 and followed an upward trend to overtake the number of second marriages at 250 thousand in 2000.
Please take time and kindly give me some feedback. I am preparing for Ielts exam, can you tell me about my mistakes and way to fix it? Thank you so much!!!

Untitled.png
