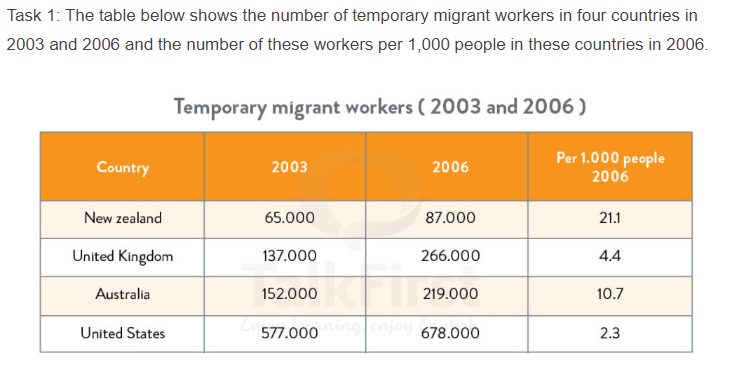
The given table illustrates how many migrants worked temporarily and the number of them per 1000 people in 4 different countries from 2003 to 2006.
Overall, it is obvious that the figures for migrant employees working temporarily in these countries rose over the period.Additionally, the statistics for New zealand was always the lowest, by contrast, that of America had the leading position over the time. Moreover, the number of temporary migrants workers per 1000 peoplein 2006 in New zealand was the highest, while the opposite was true for that in the US.
In 2003, The data for New zealand started at 65.000, which is the lowest figure in the table. In a stark contrast, America begun at 577000, the figure that was superior to that of any other countries and nearly 9 times higher than that of Newzealand.After 3 years, the figures for both New zealand and the US increased moderately to 87000 and 678000 in 2006 as well as keeping their old rank.Despite the fact that the data for America was largely higher than that of New zealand in terms of the number of migrant employees, its figure for the number of migrant workers per 1000 people in 2006 was disappointingly low, at 2.3 compared to that of New Zealand, at 21.1.
Regarding other countries, The beginning figure for England was 137000, which is slightly lower than that of Australia, at 152000.Then, in 2006, the data for Britain grew significantly by nearly a half to 2666000.The figure for Australia also saw a moderate growth to 219000 but it was overtaken by that of England. Considering the number of migrant workers per 1000 people in 2006, in England, there were just only around 4.5 migrant employees per 1000 people while there were around 11 migrant workers per 1000 people in Australia.

nhchpmnh.png
