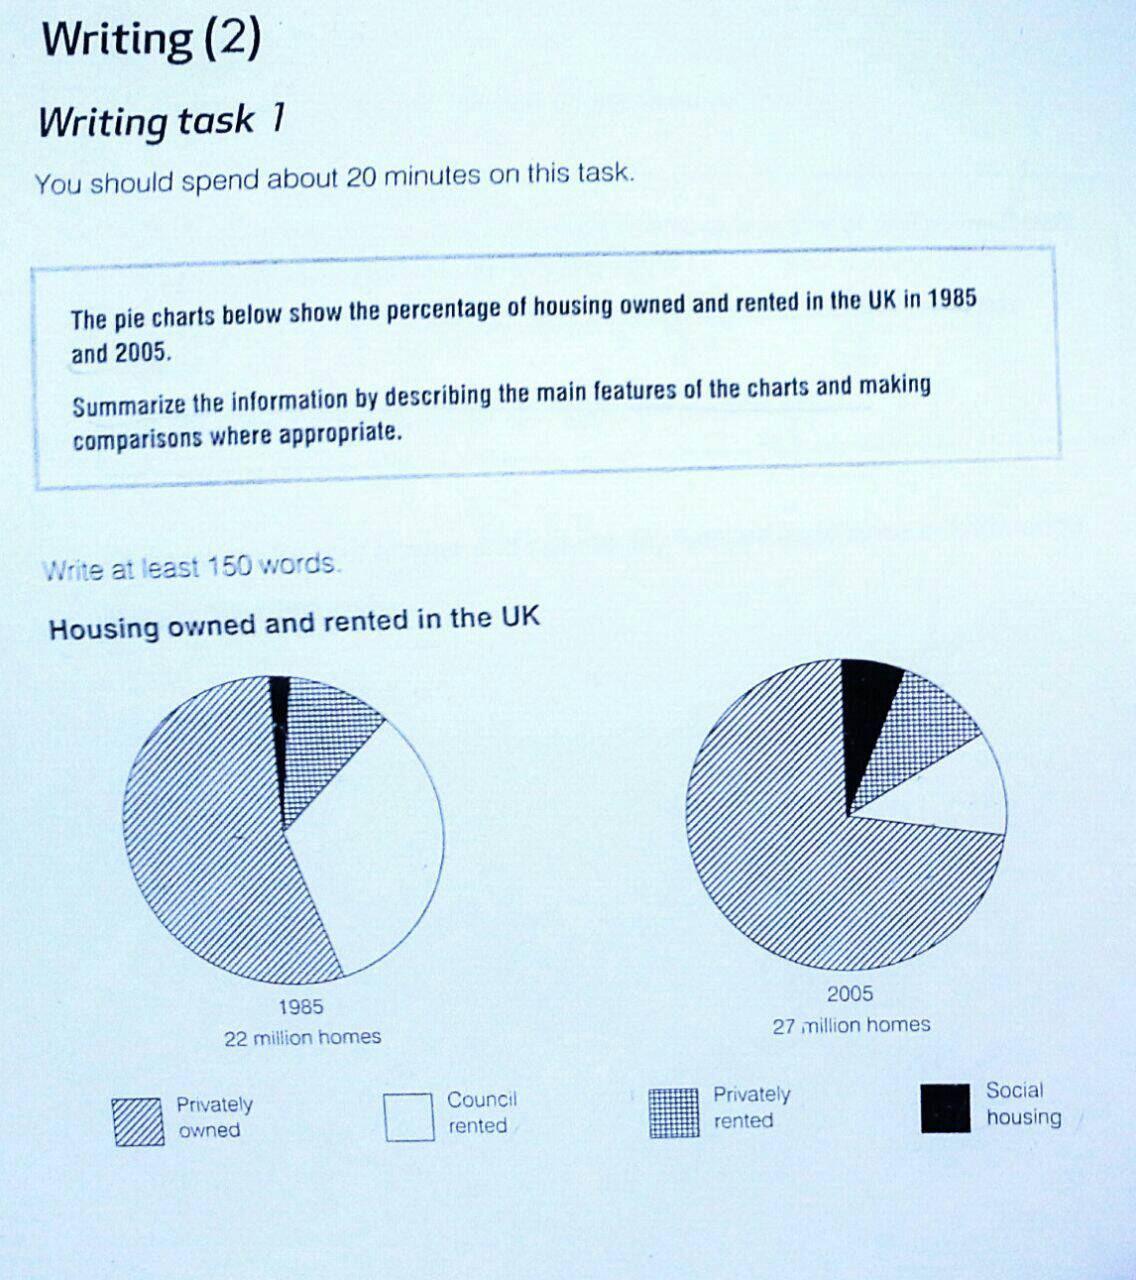
Task 1: The percentage of housing owned and rented in the UK
The proportion of housing owned and rented in the UK in 1985 and 2005 are presented in the pie charts. In 2005, there were 27 million homes which most of them are privately owned. However, both of privately owned and council rented contributed significantly in 1985.
In 2005, the privately owned gave virtually more than three-fourth of 27 million homes around UK which was the number one of contribution in housing owned and tented. The second place was given to council rented at around 15 per cent. While privately rented cintributed as same as council rented, there was only small percentage that showed in social housing.
More than half of 22 million homes in the UK were privately owned in 1985. The council rented in this year gave more proportion than in 2005 at around 30 per cent. On the other hand, privately rented contributed at certain number same as in 2005. However, there was a slight proportion that gave from social husing.

24039.jpg
