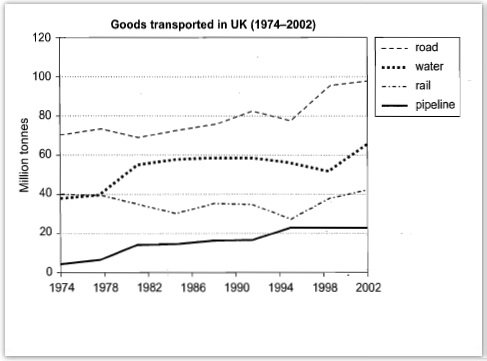
The graph above shows the quantities of goods transported in the UK between 1974 and 2002 by four different modes of transport. Summarise the information by selecting and reporting the main features, and make comparisons where relevant.
The line graph compares the amount of four distinct types of transport that is used for goods transported in the UK from 1974 to 2002. As a general trend, it can be seen that each modes of transport reveals upward trends even though it had a stead rose and some fluctuation over those years.
Look at the details, from the largest transportation mode which was taken by Road mode. There was a gradual rose in the number of transported. It was started at 70 million tonnes in 1974 and hit a high point at 100 million tonnes in 2002. The smallest was shown by Pipeline. It was started from under 10 million tonnes but increased gradually until reached peak at over 20 million tonnes in 1994 and then showed steady trend from 1994 to 2002.
Water and rail transport stood at same point almost 40 million tonnes in the beginning of survey but it showed different trend for the following years. Water mode increased sharply in 1978 until reached 60 million tonnes, and then showed stable style in the next 12 years. In 1998, water transport rose and reaches over 60 million tonnes. Meanwhile for rail mode, there was a fluctuated trend from 1978 until dipped at almost 20 million tonnes then jumped to over 40 million tonnes in 2002.

The quantities of goods transported in the UK between 1974 and 2002
