expenditure on fast foods by income groups in the uk
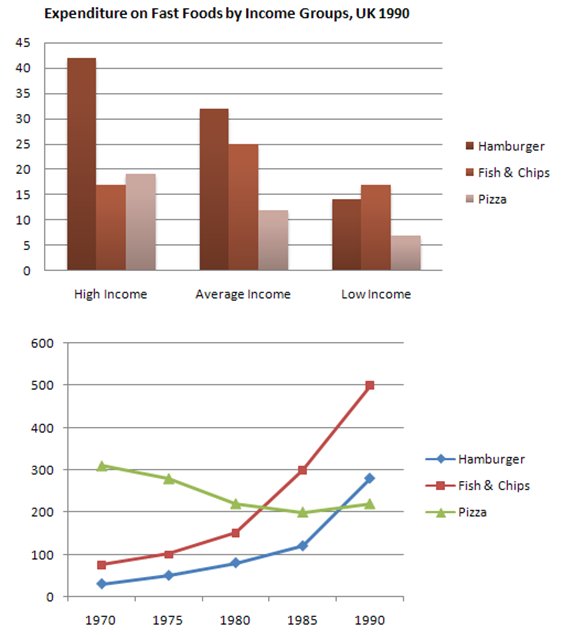
The chart compares the expenditure on fast foods on a weekly basis according to various income levels of British people, and the graph illustrates the consuming tendency of three types of fast foods.
Overall, citizens who had a higher income tended to spend more on fast foods than others. And in terms of types, hamburger, and fish&chips were becoming more popular over the twenty-year period.
According to the bar graph, high-income people loved hamburger the most which cost them more than 40 pence per week, followed by average and low income person who spent 25 and just above 15 pence respectively. In contrast, pizza was the most unwelcome food, especially for low-income people, with the least expenditure of just above 5 pence per week.
In 1970, more than 300 million pizzas were sold which ranked the first, whereas the selling amounts of fish&chips and hamburger were both under 100 million. Over the next decade, the amount of pizza sold saw a slight decline to around 200 million while the other two became more popular and overtook it in the years 1980 and 1985. In 1990, fish&chips attracted more than 500 million consumers followed by hamburger(300 million) and fish&chips(200 million).
Thanks for your time and patience♡♡♡

IELTSwriting_task_1.jpg
