writing task 1 in Ielts examination
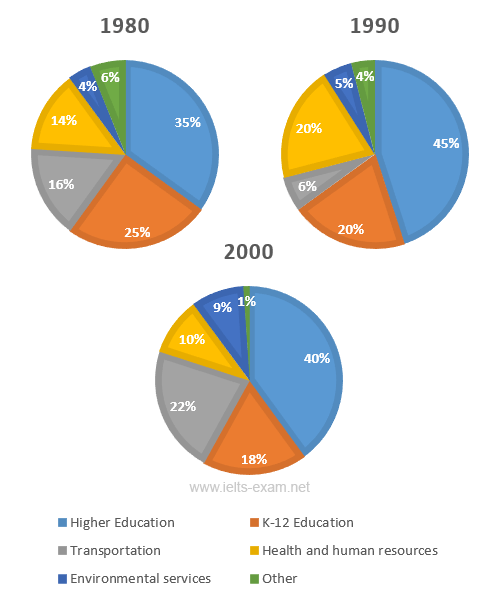
The three pie charts below show the changes in annual spending by local authorities in Someland in 1980, 1990 and 2000.
Summarise the information by selecting and reporting the main features, and make comparisons where relevant.
Write at least 150 words.
The three pie charts illustrates how much money spent on a variety of social spheres by local authorities in Someland in three separate years: 1980, 1990 and 2000
Overall, the money invested in higher education, transportation and enviromental services witnessed an upward trend, while there were corresponding drops in expenditure on K12 education, health and human resources and other aspects.
In all three years, higher education remained the largest proportion of total expenditure, increasing from 35% to 40%. Similarly, despite haiving plummeted by 10% in 1990, the financial support for transportation recovered and rose markedly to 22% .Additionally, the money allocated to environemtal services also experienced a considerable growth, initially standing at 4% and ended at 9%.
In contrast, the money spent on K12 education saw an opposite trend. In 1980, K12 education accounted for the second largest proportion of total expenditure, but ten years later, the amount of money invested in this filed declined significantly by 7%. Similar to K12 education's trend, having reached a peak in 1990, the expenditure on health and human resources decreased dramatically to 10%, a half in 1990.

1.png
