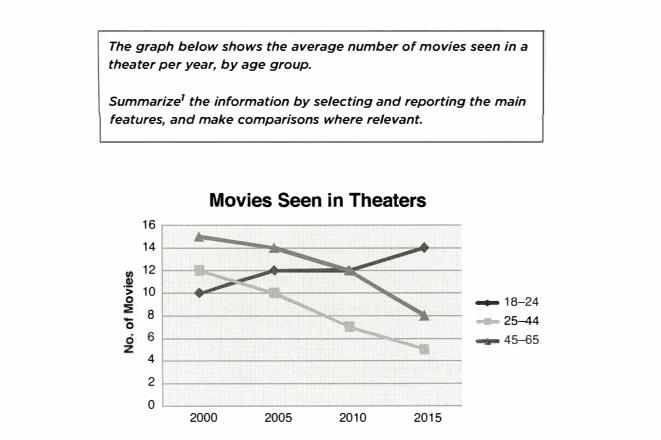
number of movies seen by people of different age
The line graph illustrates the percentage of movies which people from 18 to 65 years old saw in a theatre during the 15 years.
It can be seen that between 2000 and 2015, the number of movies seen by the teenagers at 18-24 years old had a remarkable increase while the number of films seen by the age from 25-65 decreased sharply at the same time.
In the beginning, the rate of movies which the people from 45-65 years old watched in the theatre was the highest among the age group, at nearly 15%. Meanwhile, the figures for the 18-24 and 25-44 age range were quite low at 10% and 12 % respectively. From 2000 to 2010, there was a downward trend in the average number of movies seen in the theatre by 25-44 and 44-65 year-olds people while the age from 18-24 years old rose to 12% in 2005 and remained steadily till 2010. In 2016, under 8% of movies in the theatre was chosen by people from 25-65 years old while the number of films seen by 18-24-year-olds continued growing, up to 14%.

3ceb013092c66f9836d7.jpg
