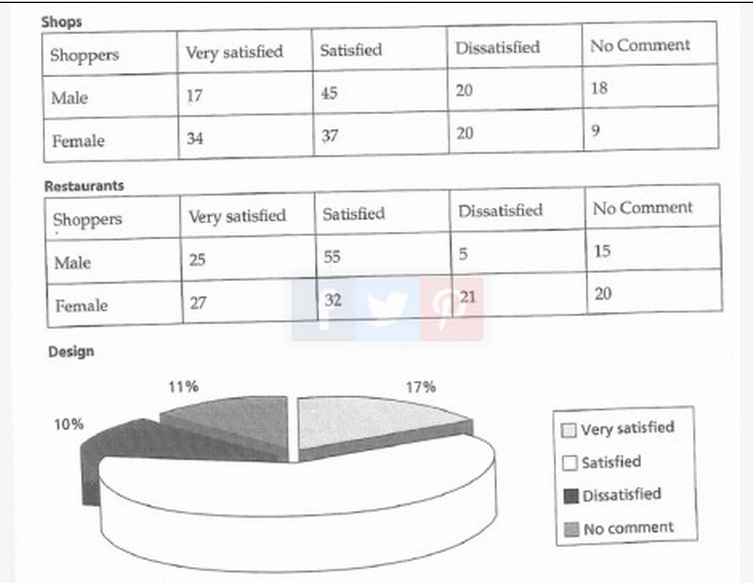
The table and diagram describe the proportion of survey to determine the level of satisfying for a novel shopping complex in Auckland, New Zealand, categorized by men and women. Overall, what stands out from the shops and restaurant show the percentage of survey in each item is highly varied. Moreover, the average of people in Auckland tends satisfied with the design of shops and restaurants.
Turning to the shops, the male is more satisfied by the appearance displayed than female. Besides, while solely 17% of men are very satisfied, the women show the double figure than men, at more than a third. Interestingly, the figure of dissatisfied witness a similar percentage.
Moving to the restaurant, standing at more than a half percent, the proportion of the men shows the enthusiasm higher than women, at 32 percent. In the same way, the figure of both genders witnesses a similar proportion approximately less then a third percent.
In terms to design, it is clear that new-zealand people is quite satisfied with proportion more than a half while other item shows the percentage roughly 15%.

257632_1_o.jpg
