the graph report
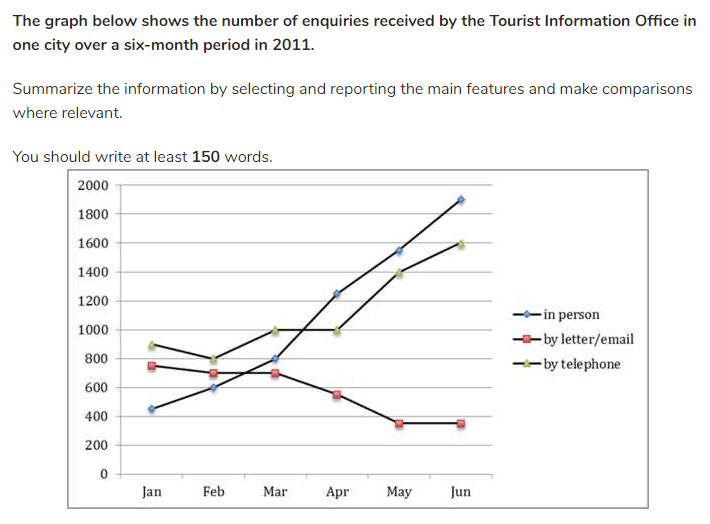
The line graph illustrates the amount of requests sent by hand, mail and phone to the Tourist Information Office in particular city from January to June in the year 2011
It is clear that the Office received enquiries in person and by cell phone rose significantly over the period of 6 months in 2011, while the number of enquiries sent by letter experienced a considerable drop.
By January, telephone was by far the most popular way, with about 900, as oppose to just nearly 800 through mail or letter. The figure for enquiries received directly from the tourists was much less, just over 400. Between January to March, the number of requests which tourists gave by hand and mobile phone climbed to 1000 and 800 respectively, however, the number of that from email remain relatively stable.
Three months later, from Match to June, there was a rapid increase enquiries sent in person and reached a peak of around 1900 in June. After unchanging in April, the calls from tourist to enquiry went up to almost 1660. By contrast, there was a downward trend in receiving by mail, with just below 400 in the last of the period.

Capture.PNG
