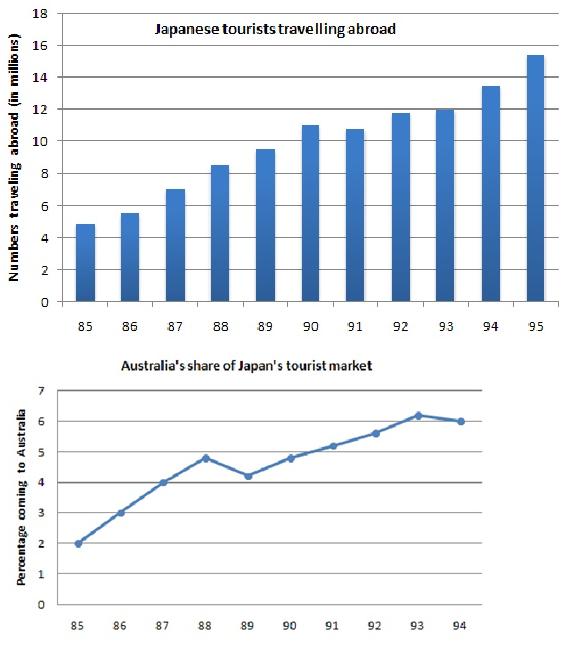
The charts below illustrate the number of Japanese tourists who have travelled abroad and Australia's share in the Japanese tourist market respectively between 1985 and 1995.
In the first bar chart,the figures for Japanese tourists travelling abroad steadily increased from around 5 mln in 1985 to nearly 11 mln in 1990.After that,it slightly declined approximately 1 mln in 1991.Next,it was recovered and continued to rise and reached a peak to 15 mln tourists in 1995.
The second line graph indicates that, the quantity of Japanese tourists who travelled to Australia has shown a dramatical growth from around 2% in 1985 to by 5% in 1988.However,in 1989,it declined gently to by 4%.From 1989 to 1993,it was steadily rose and hit the highest point in 1993 by 7%,then gradually began to fall.
Overall,these charts show us that,the number of Japanese tourists and travellers to Australia of them,have substantially gone up over a ten year period.

IELTSWritingTask1.jpg
