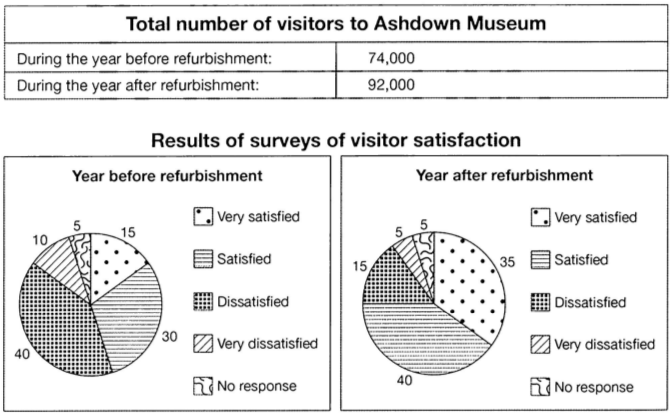
The table below shows the numbers of visitors to Ashdown Museum during the year before and the year after it was refurbished. The charts show the result of surveys asking visitors how satisfied they were with their visit, during the same two periods.
Summarise the information by selecting and reporting the main features, and make comparisons where relevant
The table shows the total number of people who visited the Ashdown museum a year before and after the changes in inside and outside of the building. Also, there are two pie charts that compare the result of the visitor's comments before and after the changes, about whether they liked the new likes or not.
Firstly, the total amount of people who visited the museum raised from 74000 before the changes to 92000 after it. In fact, by paying attention to the charts, it is understandable that the percentage of people who were satisfied or very satisfied increased from 45% to 75%.
Secondly, the portion of visitors that were dissatisfied or very dissatisfied dropped from 50% to 20%. In more details, the portion of people that have been very dissatisfied fell dramatically from 40% to 15%. Also, there are 5% of visitors who didn't engage in the survey in both years.
Overall, from the pie charts, it is obvious that more people liked the new style.
(159 Words)
Summarise the information by selecting and reporting the main features, and make comparisons where relevant
Ashdown museum visitors
The table shows the total number of people who visited the Ashdown museum a year before and after the changes in inside and outside of the building. Also, there are two pie charts that compare the result of the visitor's comments before and after the changes, about whether they liked the new likes or not.
Firstly, the total amount of people who visited the museum raised from 74000 before the changes to 92000 after it. In fact, by paying attention to the charts, it is understandable that the percentage of people who were satisfied or very satisfied increased from 45% to 75%.
Secondly, the portion of visitors that were dissatisfied or very dissatisfied dropped from 50% to 20%. In more details, the portion of people that have been very dissatisfied fell dramatically from 40% to 15%. Also, there are 5% of visitors who didn't engage in the survey in both years.
Overall, from the pie charts, it is obvious that more people liked the new style.
(159 Words)

