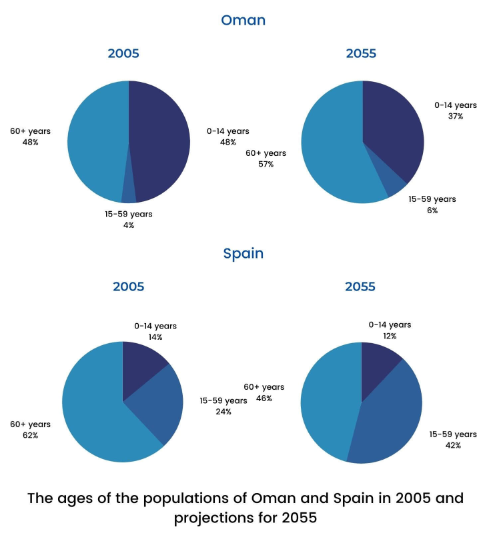
the ages of the populations of oman and spain
The given circle charts give information about population age ratios in 2005 and predictions for 2055 in two different countries namely Oman and Spain.
Overall, the initial impression is that both surveyed countries recorded the top proportion of the aging population in 2005, and a similar pattern is projected for the future in 2055. Moreover, while the rate of people who belong to the working age bracket predicted tends to upswing the opposite was true for children under working age.
In 2005, Oman witnessed parity in the percentage of people of retirement age and children under working age at 48%. Meanwhile, owning the last place is the rate of Omanis of working age with only 4%. At the same time, the proportion of those who were in their 60s or older also took up the overwhelming majority of Spain's population. This nation's children under minors and those aged 15 to 59 accounted for the lower share of 14% and just under the quarter respectively.
Predictive data accurately half a century later revealed a downswing trend in the under-14s and a growth in the working-age population. More specifically, the decline in the underage group in Oman is more than one in ten, the figure for Spain is much smaller, just 2%.In opposition, the share of the age bracket between 15 and 59 in both countries tends to rise with a slight increase of 2% in Oman and a dramatic growth at nearly one-fifth in Spain. Concurrently, the rate of older in Oman is predicted to increase by just under a tenth to 57% during the figure rapidly decreases by about one-sixth in Spain. However, that is still the largest proportion compared to the other two age bracket.

topic
pie chart
