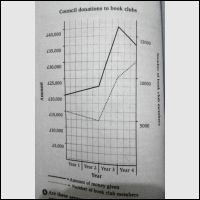
The line graphs gives information about how much money in the city council received and how many members in the book club for fourth years. Overall, in the first line shows there is fluctuation in amount of money in city council found over the period, and the second line presents there is an upward trends in the number of club members over the period.
The first line in the graph shows there slight increase between first year and second year. In the third year, amount of money has increased dramatically and reached a peak of money received over the period. However in the fourth year was fell suddenly under £ 40,000.
The second line in the graph present there decreased slightly from first year to second year. The number of book club members was rising sharply in the third year. Finally, the last year has reached a peak of book club members.

oll.jpg
