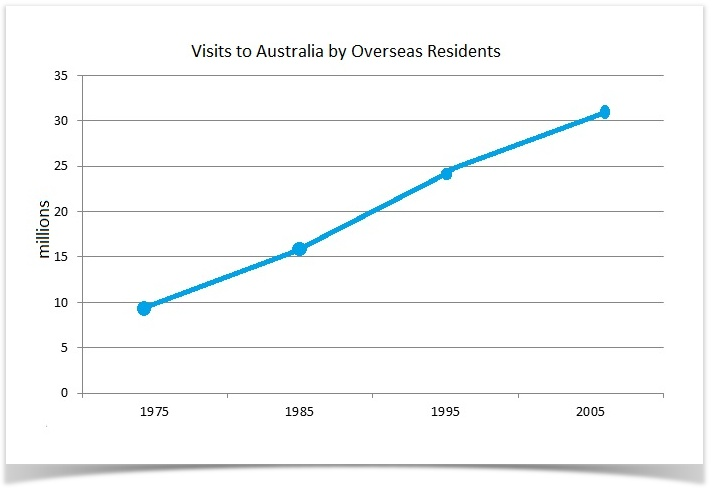
how many people visited australia in 1975 and 2005
The line graph below shows the number of annual visits to Australia by overseas residents. The table below gives information on the country of origin where the visitors came from.
Summarize the information by selecting and reporting the main features and make comparisons where relevant.
Write at least 150 words.
The line graph depicts the total number of visits to Australia made by international citizens from 1975 to 2005, and the table shows information on the nationality of tourists in two specific years 1975 and 2005.
Overall, number of overseas visitors had an upward trend throughout the period given. While Chinese residents made the fewest trips to Australia, tourists coming from Japan had the superior number of visits compared to the others in both years.
According to the line graph, in the year 1975, the number of tourists visiting Australia was 10 million people, continuing to rise to approximately 15 million in the following ten years. Similarly, it drastically increased until reaching a peak of above 30 million visitors in the last year of the period.
Regarding the table, 3.2 and 12 million Japanese people toured Australia in 1975 and 2005 respectively, which accounted for the greatest number of overseas visitors. In contrast, a mere number of visitors from China was only 0.3 in 1975 and 0.8 million of people thirty years later.
( 173 words )
Number of visitors ( millions )
Country/ Year 1975 2005
South Korea 2.9 9.1
Japan 3.2 12.0
China 0.3 0.8
USA 0.4 1.1
Britain 0.9 2.9
Europe 1.1 4.5
(Sorry that I could not upload the table )

LINE.png
