select and report main feAtures from the graph
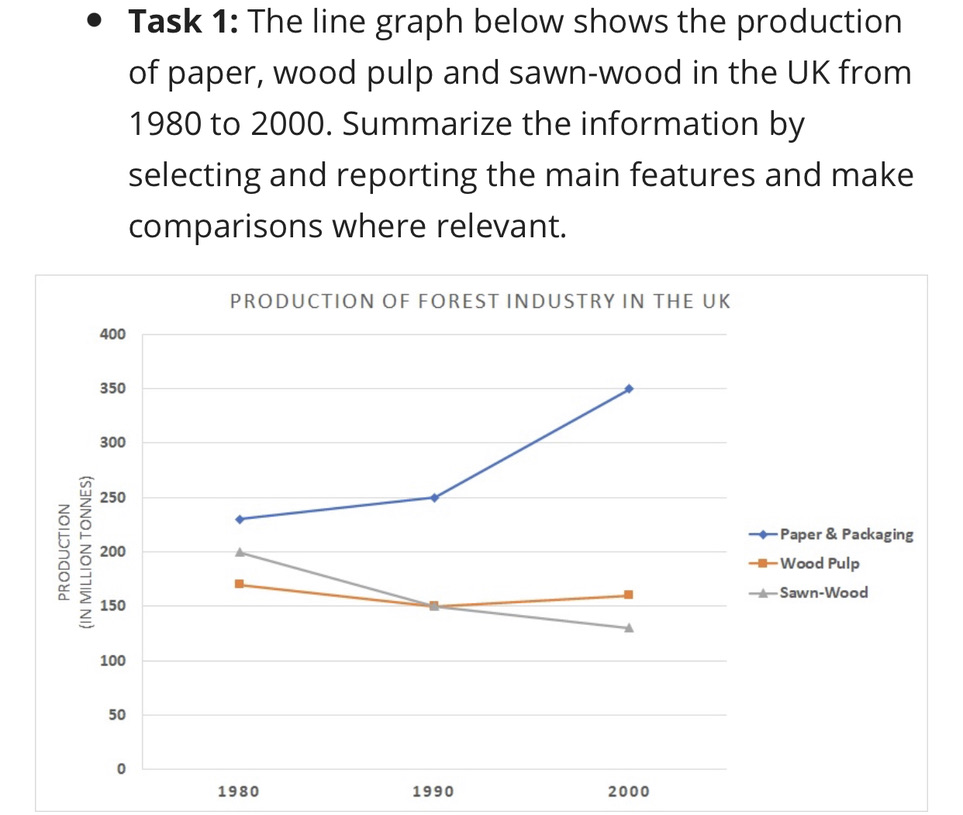
The graph illustrates how much paper, wood pulp and sawn good were manufactured in the UK between 1980 and 2000.
Overall, there was a decrease in the production of wood pulp and sawn good, while a dramatic rise was seen in the manufacture of paper & packaging. It is clear that paper & packaging consistently had by far the highest figures throughout the period, with a considerable increase was witnessed in the latter of the period.
The amount of paper & packaging produced in the UK starts at around 230 million tonnes, after which it saw a slight rise to 250 million in 1990. By contrast, 200 million tonnes of wood pulp was manufactured in 1980, with a subsequent significant decline to 150 million in 1990. A similar change, but to a lesser extent, was seen in the figure for sawn wood, which decreased from approximately 170 million tonnes to 150 million tonnes.
From 1990 to 2000, the amount of paper & packaging continued to increase sharply, reaching a peak of 350 million units. A milder growth was seen in the figure for wood pulp, hitting a high of 160 million tonnes. Conversely, sawn wood production dropped to roughly 130 million tonnes.
Thank you for helping me to correct my essay!

9A913F749F5349B48.jpeg
