Task 4 (unit 3 page 22)
Writing task 4
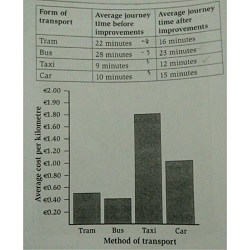
The table explains about average journey time before and after improvements based on the types of transport. Tram has a biggest improvements that experiences acceleration at 6 minutes faster than before maintenance. The next is bus that can be quicker 5 minutes than before improvements. Taxi and car are slower than before which have 3 minutes and 5 minutes for each transport. For all, car has the lowest improvement. However, both before and after refinement, we can find that taxi is the fastest vehicle than others and bus is the lowest. Related to the second bar graph, bus is the most economical cost of transport which average cost per kilometre is 0.40. In the second cheapest position is tram which the fee is 0.50 per kilometre, then followed by car that is the third with 1.00 in cost. Taxi is the most expensive vehicle with 1.80 average cost per kilometre.

1.jpg
