Your help is really appreciated!
The diagram illustrates the percentage of staff training provided from four organizations. Throughout the period from 2003 and 2006, the training staff of company A slightly increased while the others gradually rocketed.
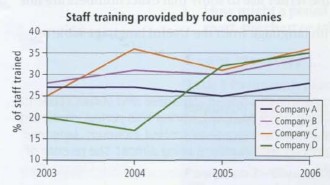
The percentage of company A stayed unchanged from 2003 to 2004 at 27 percent. Throughout the period from 2004 to 2005, the figure of this organisation started to fell sharply and then slightly increased to reach 28 percent in 2006. The percentage of staff training provided by company B rose sharply from 28 percent in 2003 to 31 percent in 2004. During a year from 2004 to 2005, the figure of this organization fell slightly from 31 percent to 25 percent. Similar to the company A, for a year from 2005 to 2006, the number in percentage of company B reach a peak at 34 percent. Between 2003 to 2005, the percentage of company C and D is opposite to each other. While the company C substantially rocketed from 25 percent to 36 percent from 2003 to 2004, the diagram shows the company D reached a low of 17 percent. Between 2005 and 2006, the percentage of staff training from company C fell dramatically from 36 percent to 31 percent. In contrast, it had a doubling in percentage from company D from 17 percent to 34 percent. Both companies' figure increased in the period from 2005 to 2006. Beside the company C has a growth to 36 percent, the other reached a peak at 35 percent.
Overall, the graph highlights the growth in percentage of staff training of four companies A, B, C and D throughout 2003 to 2006.
% of staff trained
The diagram illustrates the percentage of staff training provided from four organizations. Throughout the period from 2003 and 2006, the training staff of company A slightly increased while the others gradually rocketed.
The percentage of company A stayed unchanged from 2003 to 2004 at 27 percent. Throughout the period from 2004 to 2005, the figure of this organisation started to fell sharply and then slightly increased to reach 28 percent in 2006. The percentage of staff training provided by company B rose sharply from 28 percent in 2003 to 31 percent in 2004. During a year from 2004 to 2005, the figure of this organization fell slightly from 31 percent to 25 percent. Similar to the company A, for a year from 2005 to 2006, the number in percentage of company B reach a peak at 34 percent. Between 2003 to 2005, the percentage of company C and D is opposite to each other. While the company C substantially rocketed from 25 percent to 36 percent from 2003 to 2004, the diagram shows the company D reached a low of 17 percent. Between 2005 and 2006, the percentage of staff training from company C fell dramatically from 36 percent to 31 percent. In contrast, it had a doubling in percentage from company D from 17 percent to 34 percent. Both companies' figure increased in the period from 2005 to 2006. Beside the company C has a growth to 36 percent, the other reached a peak at 35 percent.
Overall, the graph highlights the growth in percentage of staff training of four companies A, B, C and D throughout 2003 to 2006.

This is the diagram
