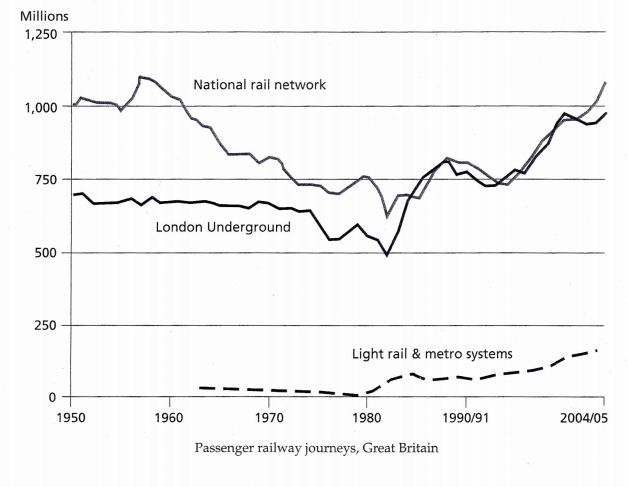
The graph below shows the number of passenger railway journeys made in Great Britain between 1950 and 2004/5.
The line graph illustrates about the majority of people travels with the railways in UK from 1950 to 2004/5 and counted by millions. The National network was a rank first as the favourite transportation. While the London Underground in the second choice for the people.
The National network had the top position in the similar pattern when it comes in 1958 and 2004/5 at 1,100. However, the London Underground reach the high value as the second choice at 900. It was the National rail network decrease since 1958 until 1983 to 600 and followed by London Underground had the lowest user at 500 in 1983.
On the other hand, the figure London Underground had the enhanced user such as 170 in the 2004/05. In which the National rail network change the improve customer around 100. It is since the rail network more populer in the human since 1950 and London Underground exist also more likely in the end year 2004/05.

1.2..JPG
