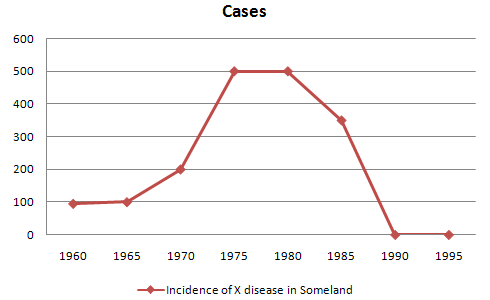
The given line graph illustrates a reserach done by a university lecturer regarding the number of incidence of X disease cases found over a 35 year period between 1960 and 1995 in Someland.
A more detailed look at the graph reveals that of 100 such cases identified at the beginning of the period remained steady at that point until 5 years later. In 1975, a tremendous increase accumulated up to 500 cases was prior to considerable increase begun in 1970. After being flattened at 500 over 5 years, the trend declined substantially and continued to fall until 1990. This final falling became the most remarkable event considering that the epidemic was succesfully eradicated.
Overall, the tendency varied declined by 100 cases comparing the beginning and the end of the period. Interestingly,the peak of of the epidemic underwent between mid seventies and early 80s which the trend alteration happened every five-year.

G59.gif
