Co2 emissions
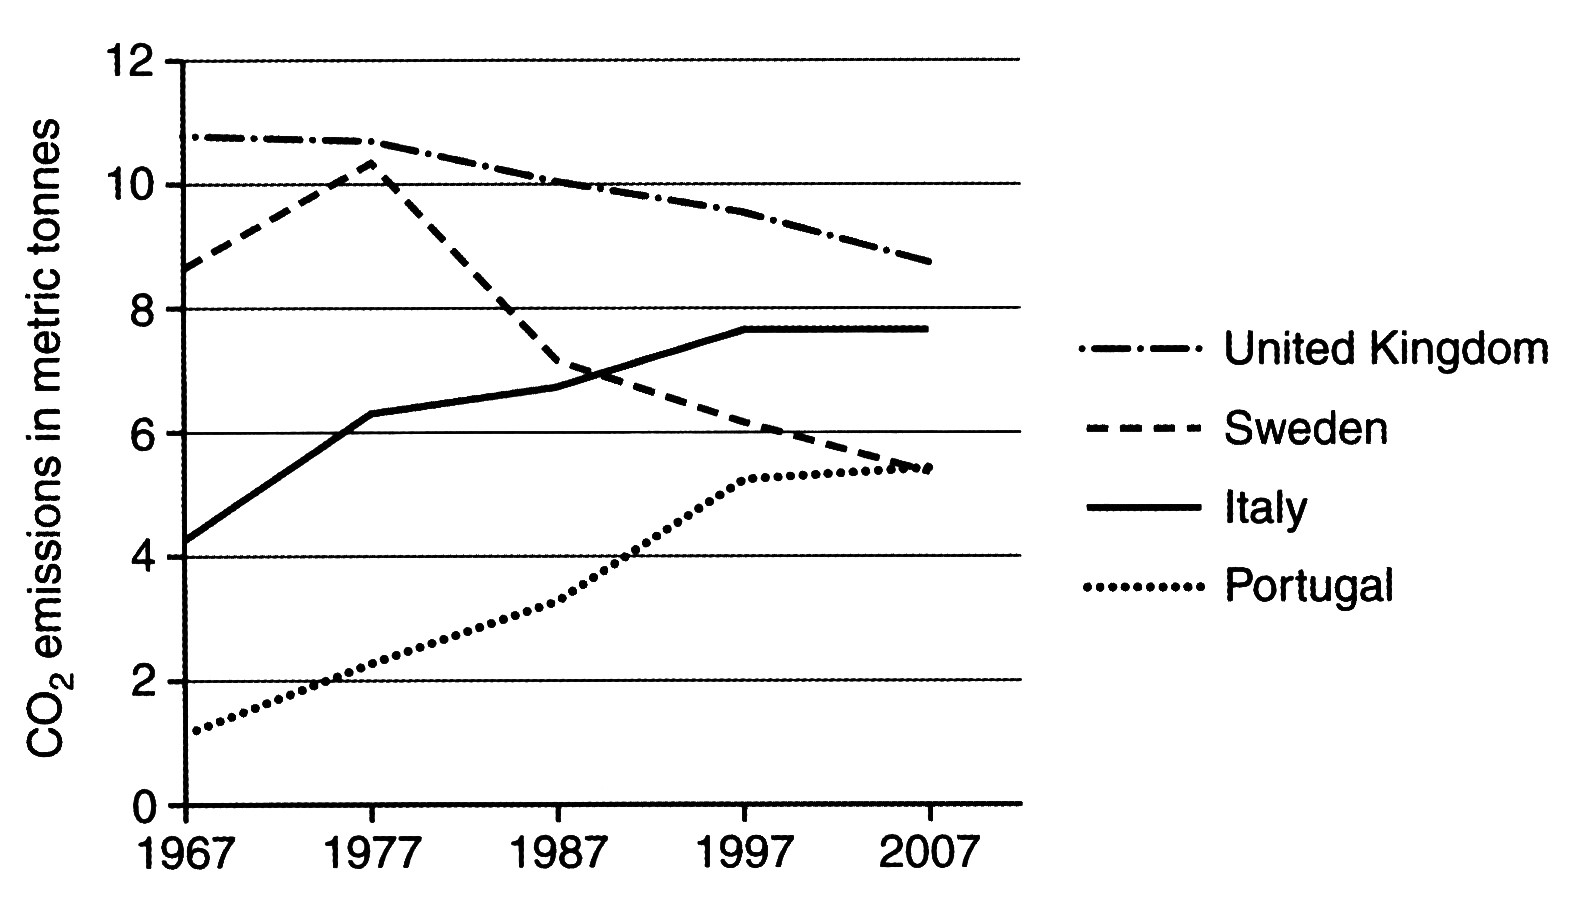
The line graph illustrated that the people of four countries discharged carbon dioxide averagely in the recent decades. The United Kingdom and Sweden are decreasing throughout the years; on the other hand, Italy and Portugal are increasing.
In 1967, the UK at the point of almost 11 and Sweden began at more than 1 metric tonnes per person, the UK remained the same till 1977, Sweden reach a peak of over 10 metric tonnes at the same year. after that, the UK slightly decline to almost 9 metric tonnes in 2007, Sweden dropped to less than 6 at the end.
At the beginning, Italy started at more than 4 and Portugal was at slightly more than 1 metric tonnes. they both rose steadily until the year of 1997, Italy remained the same to the end at almost 8 metric tonnes, and Portugal was slightly rose almost got to 6 metric tonnes.

11.3.jpeg
