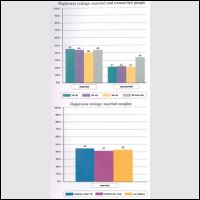
The graph below and the chart on the next page show the answers people gave about the extent to which they are satisfied with their lives and what they think would make them happiest.
Writing Task 1, Unit 7C, page 74
The graphs reveal information about people's life satisfication and two different types of factor that make them happiest that are compared by different age groups. Overall, the line graph shows clearly that there is a slight difference in the scale of happiness between male and female in the early age. Also, the main factor of happiness for younger people is money and for older people is health.
The line chart shows that the ratio of life satisfication for male stood at 5.5 and female stood at 5.3 in the early age. Both gender have the same quality of happiness at 5.3 for people aged 21 - 30. Although it decreased gradually to 5.0 for adults aged 41 - 50, it started increasing significantly at 5.6 in the elderly age.
On the other hand, the bar chart shows that the percentage of happiness which caused by money stood at 55% in the early age and continued to decrease along with the increasing of the age to 8% at over 75 year. Meanwhile, the number of happiness which caused by helath only stood at 11% for young people aged 15 - 24, but it growth gradually to 45% for older people aged 65 - 74 and remained steadily for people aged over 75. (206 words)

287400_1.jpg
