Charlestown population 1955/2015
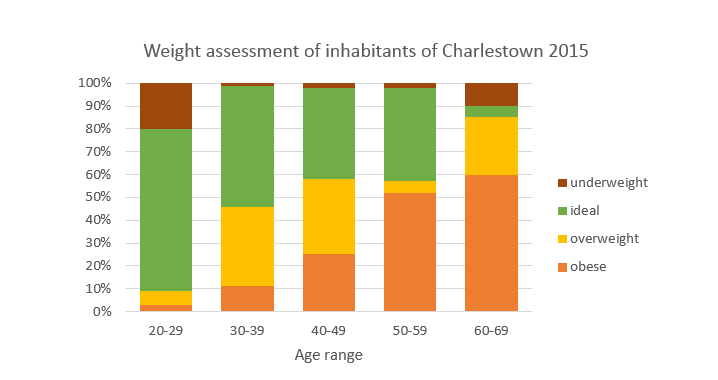
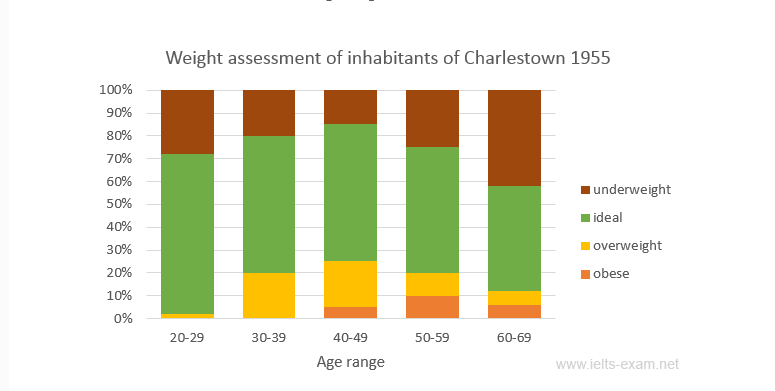
The bar charts represent the weight measurements of individuals who lived in Charlestown in 1955 and 2015. The results were measured in percentage. It appears that an increasing number of people living in Charlestown suffers from obesity as time goes by, from 1955 to 2015 and this applies to people from all age categories.
Based on the 1955 bar chart, most of people from all age categories are healthy as it indicates that, for example, over 60% of people from the age of 20 to 29 were able to maintain healthy weight. It was also noticeable that people who were between 30 and 49 years old were more likely to suffer from obesity. From the age of 50 to 69, the percentage of obese people decreased by half, from about 10 % to roughly 5%.
As for the 2015 bar chart, it is obvious that the older one becomes, the more likely he will become obese. Only 1% of people aged 20 to 29 experienced this while approximately 60% of people from the oldest group were obese. The rate of obesity appears to increase progressively, from the age of 20 to 69. The youngest group was the most successful in keeping ideal weight as almost 70% of them were able to do so which was totally opposite to the oldest group. Nonetheless, the oldest group in both 1955 and 2015 had pretty high percentage of underweight people compared to other groups, around 40% and 10% respectively.

1.PNG
2.PNG
