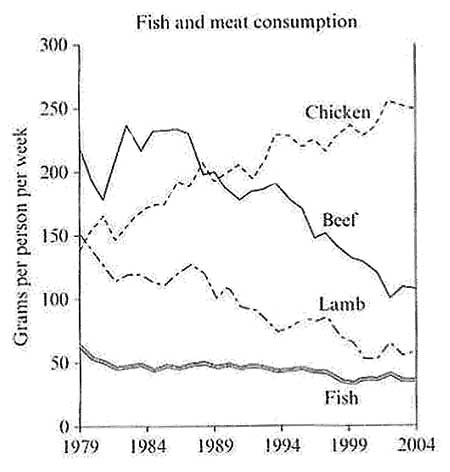
The lines graphs illustrates the needs of fish and different kinds of meat consumed by people in a particular European country over period 25 years.
It is clear that the noticeable trend was the consumption of beef and lamb tended to decline but the chicken had to a significant increasing year by year. Meanwhile, the fish was a remain steady.
In 1979, the percentage of beef consuming was the highest around 220 grams per week per person. In comparison, the other kinds of meats which was consumed by the people were 150 grams of lamb,140 grams of chicken and 60 grams of fish respectively. The consumption of beef and lamb started decreasing gradually in 1989. On the contrary. the number of the chicken significantly increased about 60 grams per week. While, the fish declined slightly around 10 grams since 1979.
By 2004, People preferred to consumed chicken than other meats in which this tendency made a substantial fluctuation of chicken at 250 grams per week. On the other hand. the trend of beef and lamb had a gradual fall every year. Lastly, The fish consuming kept stable about 50 grams per person per week.

graphfishmeatcons.jpg
