University graduates, canada
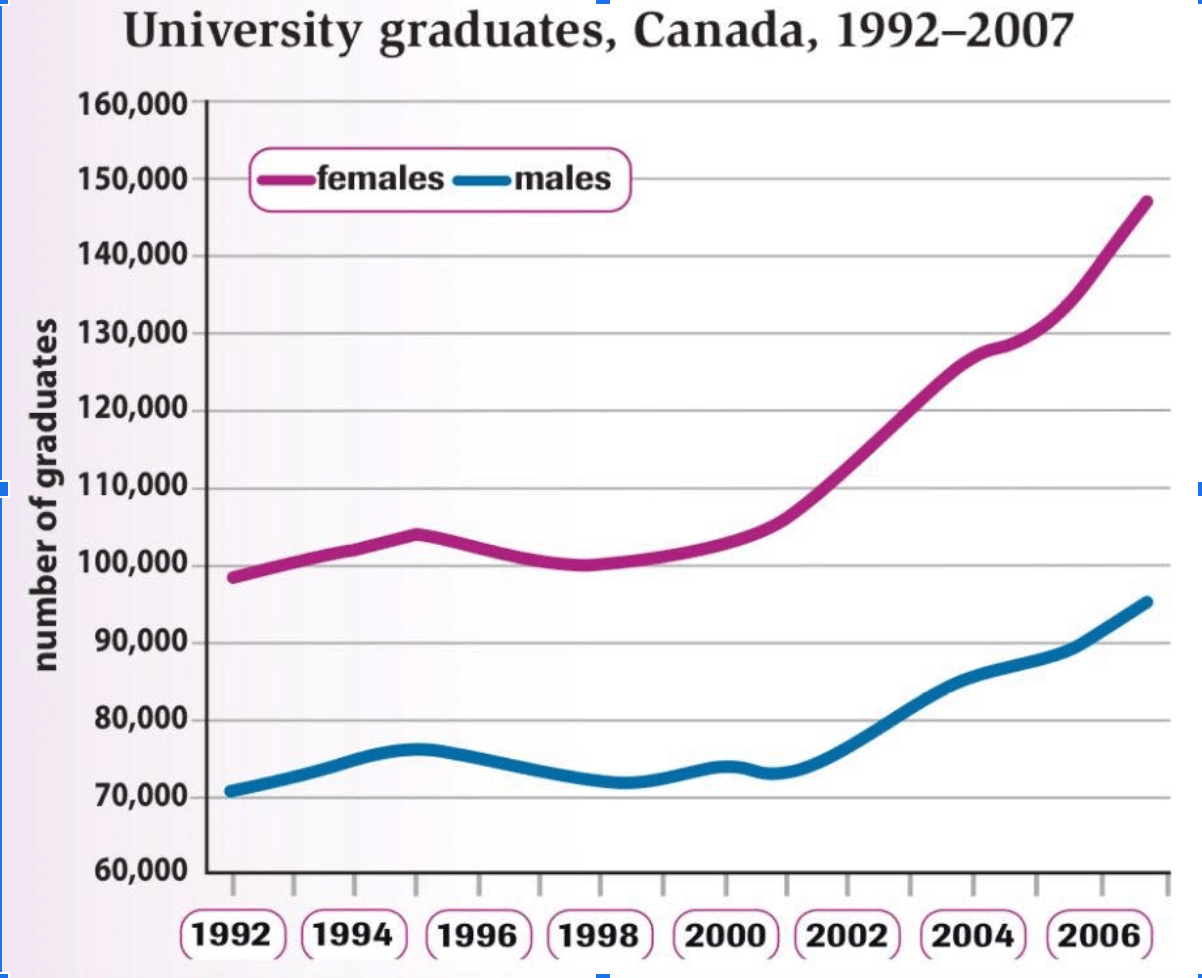
Task 1: The graph below shows the number of university graduates in Canada from 1992 to 2007.
Summarise the information by selecting and reporting the main features and make comparisons where relevant.
The line graph compares the number of people who had university degrees of males and females in Canada in the period of 15 years. The blue line represented for males and the red line represented for females.
It is clear that the number of graduates witnesses an upward trend in both females and males, with females' figure saw a more dramatic change.
In 1992, around 70,000 men owned university degrees, compared to about nearly 100 thousand individuals of females. The number of graduates grown progressively in the next 10 years for both females and males.
In the later part of the period, sudden increases in the number of people obtained degrees were experienced for both men and women. There was a sharp increase for women, around 40,000 peoples in just 5 years from 2002 to 2007. By 2007, the figure recorded that nearly 150 thousand women and about 95 thousand men had university degrees.

ScreenShot202005.png
