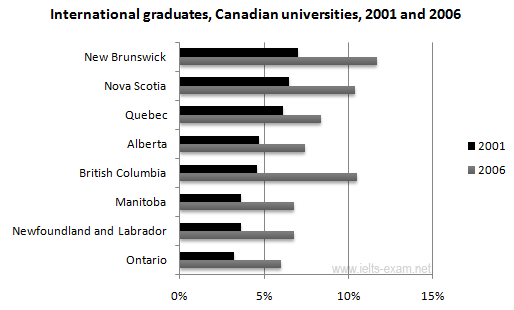
The percentage change in the number of international students graduating from universities in different Canadian provinces between 2001 and 2006.
A breakdown of the proportion alter of the figure for overseas students graduating from third-level education in several Canadian provinces, categorized by eight provinces from 2001 to 2006, a 5 - year period is presented in bar chart. Overall, except Alberta, there was an upward trend in all provinces. In any case, while New Brunswick saw the highest proportion in international graduates, Alberta witnessed a reverse, as the least graduates over the question period.
It is clear that international students in several provinces showed a different proportion of graduated students. Standing at 7 percent in 2001, New Brunswick dominated all percentages, while Ontario was the lowest rate for international students who graduated from universities. In the following 5 years, the first province was still the highest figure, and this was followed by Nova Scotia and British Columbia as the second highest graduated students, virtually one in ten percent. In contrast, Alberta became the lowest figure for international graduates changing the position of Ontario.
Interestingly, foreign students of Makitoba and Newfoundland; Labrador Increased significantly to 7 percent, rising a half of the first year period.

IELTS_Writing_Task_1.png
