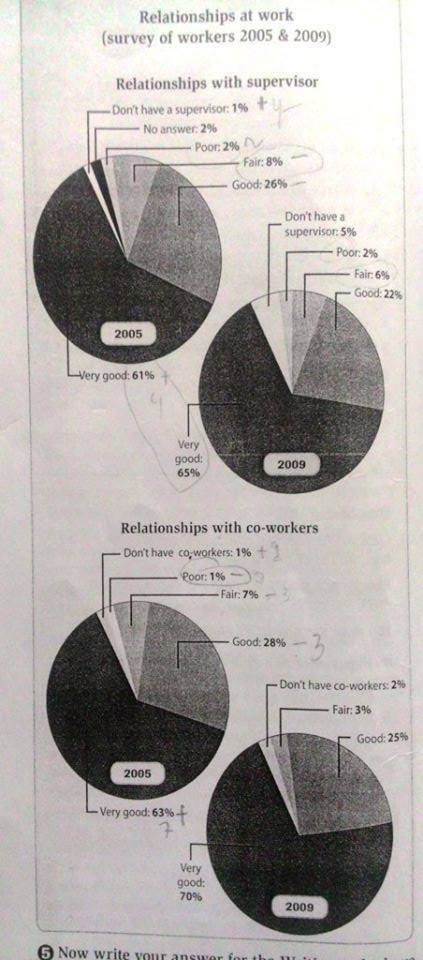
The charts below show the results of surveys in 2005 and 2009 asking workers about their relationship with their supervisors and their co-workers
The pie charts show the information about the percentage of employee relationship with their boss and peers at the office between 2005 and 2009. Overall, it can be seen that the most of relationship between workers and their supervisor and colleagues were very good in both years.
Meanwhile, people who work without have any partners were the least during this period.
The workers who have very good relationship with their supervisor stood at 61% in 2005. There was a slight increase by 4% in 2009. In contrast, poor category had small proportion only 2% in both years. In 2005, there were 2% of workers who did not answer about their relationship with their boss and it disappeared in 2009.
The relationship with their peers in category very good in 2005 and 2009 were the highest proportion, 63% and 70% respectively. While, there was 1% poor relationship with co-workers only in 2005. There had been a decrease between 2005 and 2009 in good category, from 28% to 25% while fair category fell of 4% to 3% in 2009.

wt_1_3_nov.jpg
