Unanswered [0]
  

Home / Writing Feedback   % width   Posts: 4


Writing task 1: the percentage of female members of parliament of euroupean countries


nhantran 1 / 4  
Aug 28, 2017   #1

women present in the main government body


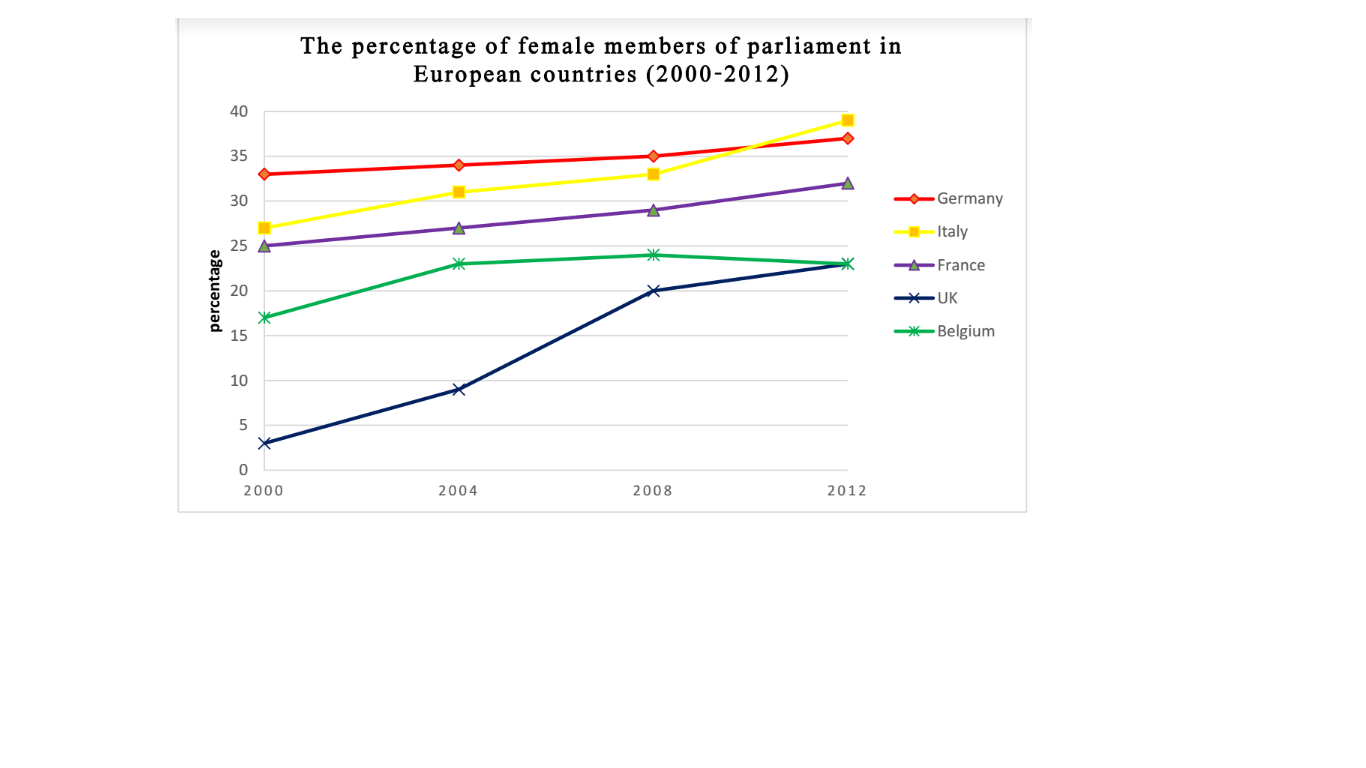
The line chart gives information about the percentage of women who are the members of parliament in five countries namely Germany, Italy, France, UK and Belgium over a 12-year period.

Overall, there was an upward trend in the number of female members of parliament in all countries, with an exception for Belgium.

In 2000, Germany saw by far the highest number of female working in parliament, at around 34% while the second biggest proportipn was seen in Italy, at nearly 27%. In the following 12 years, female members working in parliament in Italy increased considerably, rising to nearly 40% whereas this figure for Germany was just at 37%. As a result, Italy had by far the highest number of female members of parliament in 2012.

In Belgium, by contrast, this figure fell gradually from 2008 to 2012, standing at 24% in 2012 and had the same percentage with the UK in the same year. The number of France women working in parliament increased slightly, rising from 25% to over 30% over a period of 12 years.

  • Untitled.png


Yulia Indah 4 / 6  
Aug 29, 2017   #2
@nhantran
hi .. I see that you are good to pick up data. In point of view, there are 2 problems you made in your writing such as error spelling (proportion) and some repetitive adverb. You very often use far and nearly, you could change in other expressions. Additionally, it would be better, if you separate the scope of explanation, perhaps in the first body explain all the comparison then for the second body you could write related to trends.
Holt  Educational Consultant - / 15469  
Aug 29, 2017   #3
Nhan, it is difficult for me to offer a more accurate assessment of your work because you neglected to upload the necessary prompt instructions from the original source. As such, I am not a position to determine if the notes that you are reporting on are accurate, informative, or required by the task. Going by experience though, I would have to say that you wrote just enough to meet the word requirements of the essay, but not enough for an increased passing score. Why did I say that? You reported on the most obvious elements of the graph that are easily seen at a glance. A task 1 essay always, always scores its best in all criteria when the examiner sees that the exam taker spent a little more time in analyzing the image by reporting on small details that can only be discovered through analysis and comparison of the graphs. What information did you miss out on?

1. You missed out on the opportunity to report on the overlapping estimated figures for Germany and Italy during a period between 2008 and 2012;
2. France and the UK also had a point where their figures were reported as the same at the end of 2012;
3. Aside from the UK, that trailed at the start of 2000 in terms of female parliament members, France, Italy, and Germany were on a similar trend for the periods of comparison indicated.

4. By the end of 2012, all countries indicated similar figures regarding their female parliamentary membership.

This graph has a particular interest in representing trending information and that should have been reflected in most parts of your summary report. Small but relevant information such as these will make a tremendous difference in your overall score.
OP nhantran 1 / 4  
Aug 29, 2017   #4
Hi. I just don't know how to say thank you. I'm learning IELTS by myself at the moment and there is no one showing me these things before. I will keep your advice in mind. Thank you!


Home / Writing Feedback / Writing task 1: the percentage of female members of parliament of euroupean countries
ⓘ Need Writing or Editing Help?
Fill out one of these forms for professional help:

Best Writing Service:
CustomPapers form ◳

Graduate Writing / Editing:
GraduateWriter form ◳

Excellence in Editing:
Rose Editing ◳

AI-Paper Rewriting:
Robot Rewrite ◳