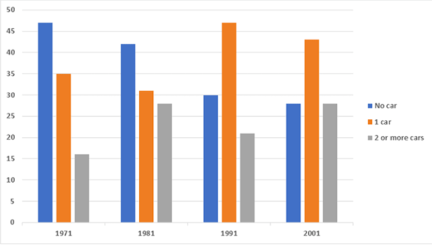
families with cars statistics
The given bar chart illustrates the alterations in the proportion of families with cars in one European country from 1971 to 2001.
Overall, it is clear that the percentage of households having no car decreased significantly over the period, while for those having at least one car increased. It is noticeable that at the start of the period, the proportion of no car ownership was the highest in a European country, which was replaced by one car in the final year.
Regarding the number of homes with no car, it was at under 50% in 1971, followed by a steady decline by more than 5% each decade before hitting a bottom of 30% in 2001. By contrast, those houses with one car fluctuated significantly between 35% and its peak of 47% in 1991, followed by a slight decrease to under 45% in the last year.
The proportion of households having 2 or more 2 cars was about 15% in 1971, after which it experienced a sharp increase to almost 30% in 1981, then this figure fluctuated significantly between 20% and 30% before standing at about 28% in the final year.

The bar chart below shows changes in the percentage of households with cars in one European country
