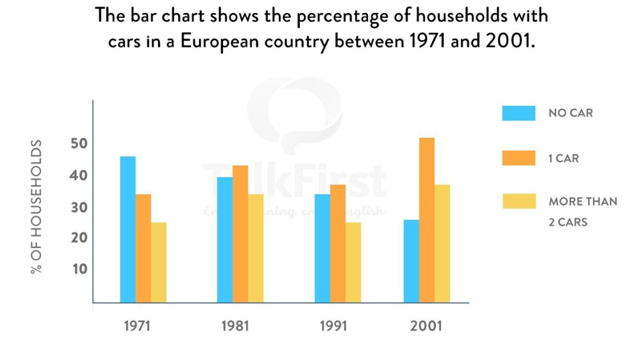
The bar chart shows the percentage of households with cars in a European country between 1971 and 2001. Summarise the information by selecting reporting the main features, and make comparisons where relevant.
__
The bar graph depicts the ratio of families with cars in a European nation from 1971 to 2001. Overall, it can be seen that a decrease in households without cars over time, while the other two types of households have been on the rise, except for the year 1991.
The percentage of homes with one car in 1971 was only 34% but increased to 43% in 1981. However, it dropped again from 43% in 1981 to 37% in 1991. Finally, in 2001, this ratio skyrocketed and reached a peak of 50%.
Next is the ratio of households with more than 2 cars in a European country. It began at 25% in 1971 and climbed to 35% by 1981. Nonetheless, the percentage decreased once more by 1991, reaching the same level as in 1971 at 25%. Ultimately, it rose 10% from 1991 to 2001 and ended at 36%.
On the other hand, the proportion of houses without cars is in contrast to the proportion of houses with 1 car and more than 2 cars. Because it did not increase at all, it was at 47% in 1971 and fell steadily by more than 5% each decade to end at 27% in 2001.

thepercentageofho.png
