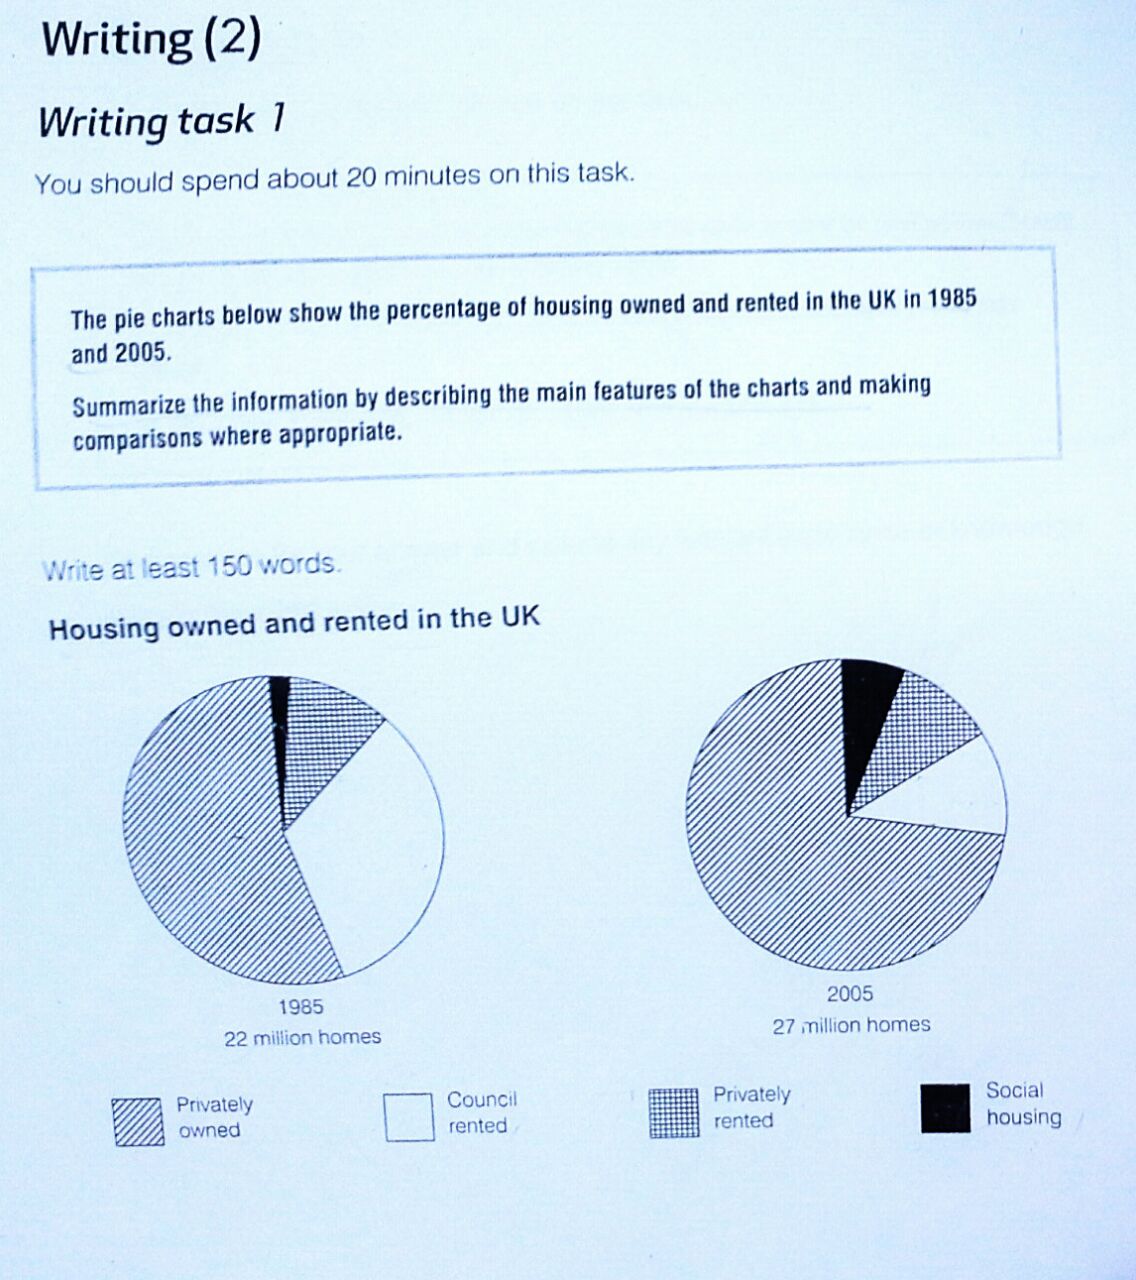
The pie charts below show the percentage of housing owned and rented in the UK in 1985 and 2005.
The proportion of own and rented house in the UK between 1985 and 2005 was illustrated in the pie charts. Overall, it can be seen that there was a significant growth in the number of homes and the percentage of own private house dominated this accommodation. While in the rent types of house, the figure of council house decreased during 2 decades.
Both types of owned and rented house rose from 22 million to 27 million homes, accounting for 5 million increased over 20 years. In 1985, the most popular house was privately owned house, representing over three-fifths of all types of houses, and it was still popular that increased to a significant proportion in 2005. The figure for social housing also had the same trend that having 3% increased starting at one in twenty in 1985.
In the types of rent houses, people were more prefer to rent council house than private house
at over less a fifth and over one in ten respectively in 1985. However, the percentage of council house decreased dramatically to reach 12% then the figure for private house remained stable.

IMG20160813WA0006..jpg
