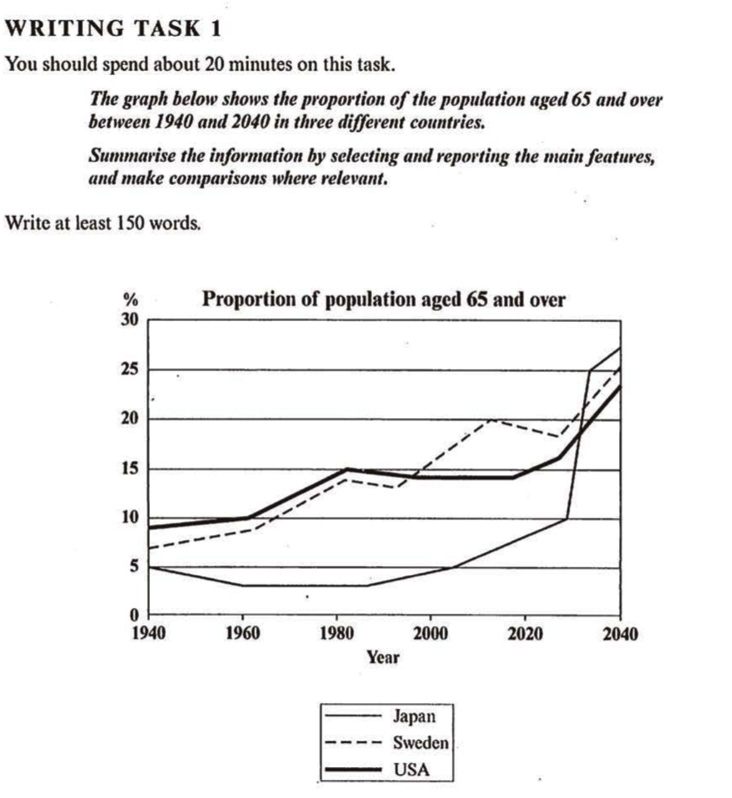
Population aged 65 and over
The line graph gives information about the percentage of people who are 65 and older in the USA, Sweden, and Japan from the year 1940 to 2040.
In all three countries, senior citizens aged 65 and over will take up a much greater proportion of the population in 2040 than they did in 1940. Obviously, the US had the highest proportion of aged population among all three nations in 1940 and Japan had the lowest; however, they are predicted to switch positions by 2040.
In 1940, the whole population in the US and Sweden consisted of approximately 9% and 7% of people who were at 65 and over respectively, and there was a gradual rise in the percentage of aged population in both countries in the following decades. Entering the early 1990s, the percentage of the elderly population in Sweden surpassed that in the US, and it is projected that around a quarter of the Swedes will be older than 65 in 2040, and so will be 23% of the Americans.
In terms of the Japanese population, only one in twenty were at 65 and over in 1940, and this continued to drop and bottomed at roughly 3% between 1960 and 1990. Since then, the proportion started to rebound and is expected to double by 2030. Thereafter, the Japanese aged population will rocket, pass the US and Sweden, and reach approximately 27% in 2040.
(Thanks for your time and feedback.)

WX202105061323482x.jpg
