Hi, I'm Sari, I student from Palembang city, Indonesia. Here is writing that I have written to describe the detail of the figures. Would you please let me know you comments. Thank you in advance.
Question :
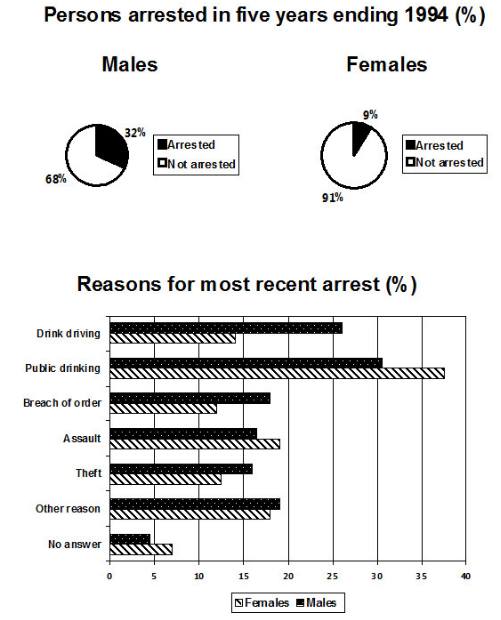
The pie chart shows the percentage of persons arrested in the five years ending 1994 and the bar chart shows the most recent reasons for arrest.
Sumarise the information by selecting and reporting the main features, and make comparisons where relevant.
The two pie charts compare the proportion of males and females who were arrested starting in 1989 and ending in 1994. Then, the bar graph illustrates the percentage of most seven reasons for different genders. It can be clearly be seen that the rate of men were arrested higher than women. Following that, the most reasons for arrests in every gender was a public drinking.
A closer looked at the bar chart, the percentage of males were arrested was higher than females. There were about 32% of men and just 9% for women. In addition, there were the main seven reasons that were caused arrested persons. Public drinking was the common reason for arrests both of females and males from the other reasons, roughly 31% and 37 % respectively, while the rate of women was higher than men. There are four reasons that were dominated by males were arrested (drink driving, breach of order, theft and other answer), where they were in the range of 16% - 26 %, while the proportion of females in the range 12 % - 13% in the same reasons.
In the other hand, assault was popular reason for females than males, roughly 19% compares around 12%. Next, no answer was the lower percentage both of men and women were arrested.

13151584_12087379091.jpg
