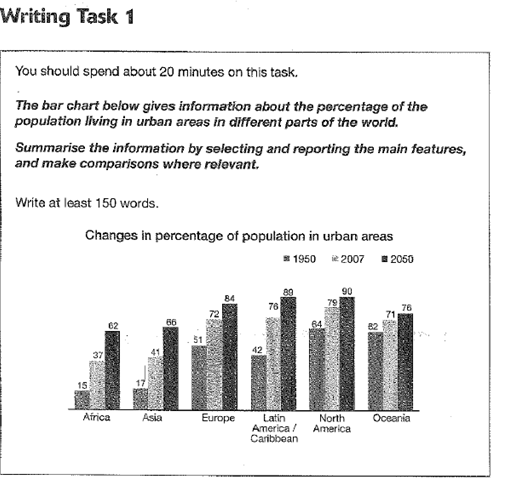
The given chart shows us the total of urban-living people in diverse countries between 1950 and 2007 and the forecast for future in 2050.
It could be seen noticeably that the total of urban area recidents virtually tended to double in all countries over a 57-year period, except the projection to the future will decrease significantly in Oceania.
From 1950 to 2007, The North America was responsible for thet urban-living people at just over 50%, following by Latin America and Europe, ranging from 50 to 76. However, the total of recidents in those countries reached the peak in 2007 at around 70. Conversely, Asia and Africa had a similar level of urban-living people at just under a half over the period shown, with Asia as the lowest level.
Moving to the projection in 2050, there are two countries will be the most popular for urban-living recidents, North America, Latin America and Europe with just above 80%. In the other hand, The Oceania, Asia and Africa will be at around 67, from 62 to 76 with Africa as the least level.
To sum up, the data gives the information that for those living in urban area grew up between 1950 and 2007 and are still going to incline in 2050.
Somebody.. please help to correct my writing task 1.. Thanks in advance..

chart.png
