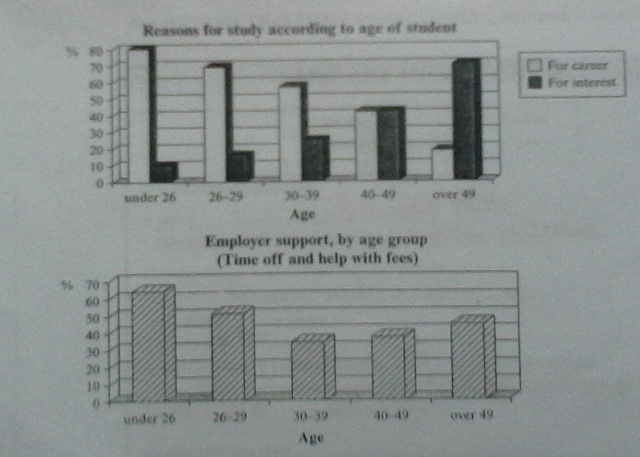
The charts give information regarding the reasons for study according to age of students and the number of employer support by age group and both are measured in percentages. Overall, what stands out from the charts show that the percentage of people under 26 is the highest of percentage in both charts and the lowest percentage of employer support is people's aged 30-39.
With regard to the first chart, the highest percentage reason for study is students' under 26 for career at 80% which is 70% higher than for interest at the same aged categories. It is followed by people aged 26-29 at approximately at 69% for career compare with some 25% for interest. Next, people's aged 40 to 49 have the same figures at 40% whereas, the percentage for interest of people's over the age of 49 is higher than for career at 70% and 18% respectively.
Moving to a more detailed analysis reveals that people's aged under 26 is the highest of percentage of employer support at some 65%. Whereas people in the age of 26-29 have 50% of employer support as the second highest percentage, elderly people follow this trend at approximately 45%. In addition, with about 38% people in the 40-49 age group are fairly low, it is nearly similar pattern with people of 30-34 ages at 35%.

Task_1_ke_10.jpg
